Measurement and Psychometrics
Exploratory Data Analysis For Epidemiology
Learning objectives for this lesson:
- Describe the parts of a measure (construct, domain, item, instrument, scale, subscale and index), distinguish a reflective scale from a formative index, and explain why internal consistency statistics such as Cronbach's alpha apply only to a scale.
- Explain how item answers become scores: why reverse-worded items must be recoded according to the scoring manual before items are combined, how a missed reversal shows up in R output, and what a published cut-point gains and loses.
- Interpret reliability as the share of observed-score variance that is true-score variance, explain how random measurement error weakens observed associations, and identify which kind of reliability (test-retest, inter-rater or internal consistency) a study design can estimate, interpreting a given intraclass correlation or Cohen's kappa.
- Interpret Cronbach's alpha and McDonald's omega from R output, including corrected item-total correlations and alpha-if-item-deleted, judge whether a reliability is adequate for a stated use, and explain what alpha cannot show and what to do about a weak item.
- Explain validity as an argument for a stated use in a stated population, distinguish it from reliability, classify validity evidence (content, criterion, convergent, discriminant, known-groups and structural), and explain the minimal important difference and measurement invariance.
- Interpret an exploratory factor analysis (suitability, parallel analysis, rotation and loadings) and a confirmatory factor analysis (the chi-square test, the CFI, TLI, RMSEA and SRMR, standardized loadings and the comparison of one-factor and two-factor models), and explain what the results mean for how a scale is scored and reported.
- Explain the core ideas of item response theory (item difficulty, item discrimination, item characteristic curves and test information), and compare how item response theory and classical test theory describe precision.
This course was developed by Dr. Kiffer G. Card based on Dohoo, I. R., Martin, S. W., & Stryhn, H. (2012). Methods in Epidemiologic Research. VER Inc.
Glossary: Key Terms, People & Concepts
📚 Reference page, available throughout the lesson
This glossary collects the key concepts, methods and people in this lesson. It can be used as a reference while working through the material or as a review before assessments. Typing in the search box filters the entries.
r.drop in psych::alpha()). Low values identify weak items.
psych::fa().
fa.parallel().
lavaan::cfa().
From Constructs to Scores
Text answers become numbers, and three items are reversed
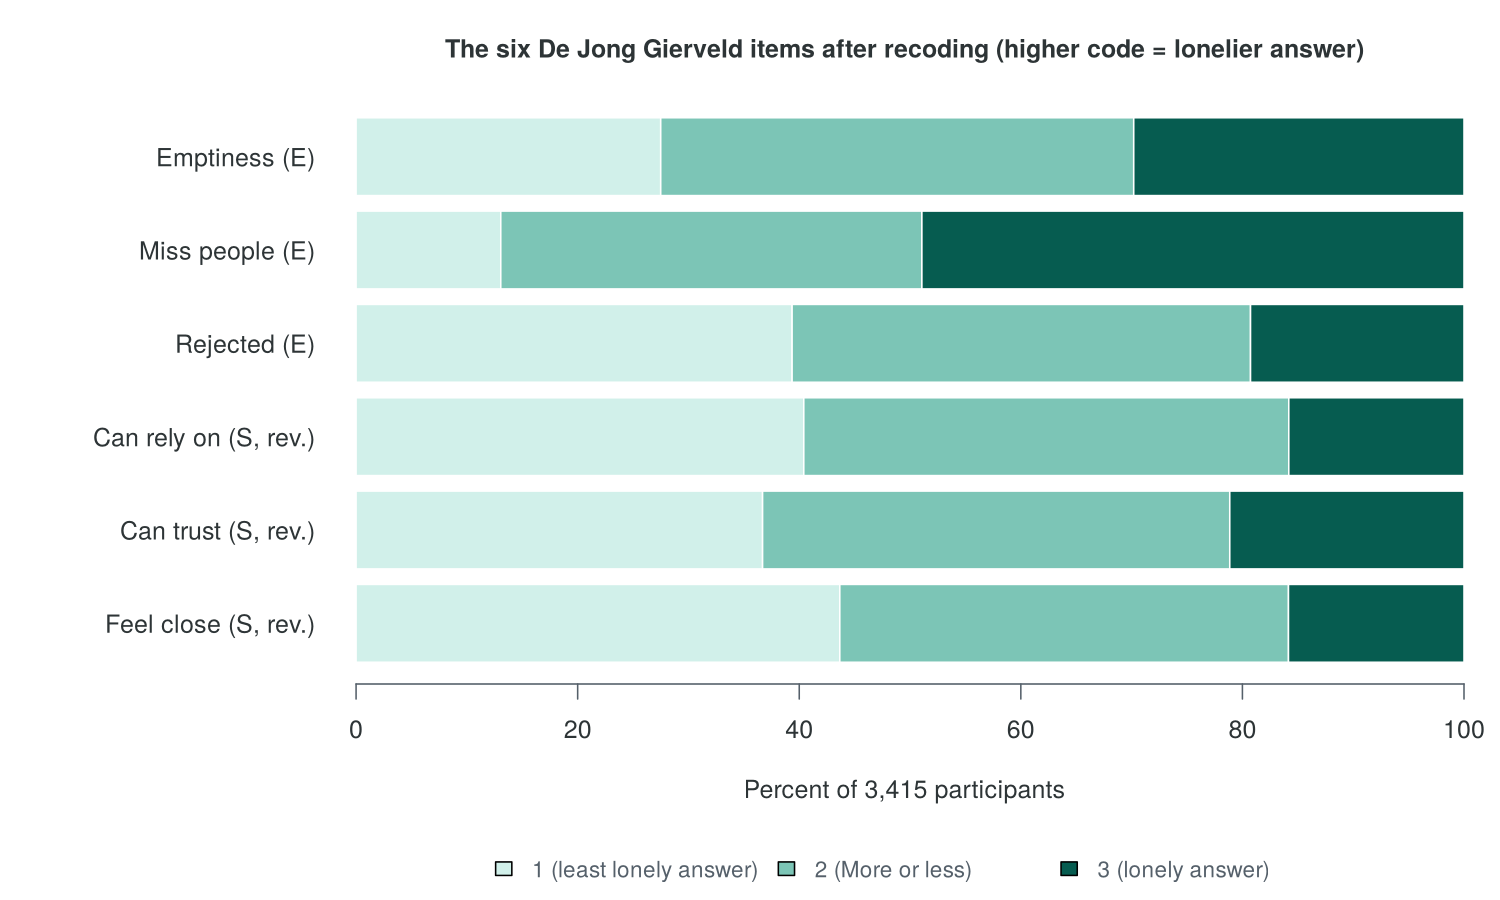
The published rule turns answers into a score
- Each item scores 1 for "More or less" or the lonely answer.
- The emotional and social subscales each run from 0 to 3.
- The total score runs from 0 (not lonely) to 6 (most lonely).
- Amira's scores match the supplied score for all 3,415 people.
Measurement error weakens correlations
Overview
Many of the variables in health research describe things that cannot be observed directly. Loneliness, social support, depressive symptoms and health literacy are measured by asking people several questions and combining their answers into a score, and the quality of every later analysis depends on that score. This lesson takes the analyst's view of building and checking such a score, using the six items of the De Jong Gierveld Loneliness Scale, three of which are reverse-worded: how scales are built, how their reliability and validity are judged, and how factor analysis and item response theory test whether the items behave as the scale's authors intended. This first section sets out the vocabulary of measurement, separates scales from indices, describes levels of measurement and scoring rules, prepares and scores the loneliness items used throughout the lesson, and introduces classical test theory and its account of measurement error.
Learning Objectives
- 1.1 Define construct, latent variable, domain, item, indicator, instrument, scale, subscale and index, and give an example of each from the De Jong Gierveld Loneliness Scale.
- 1.2 Distinguish reflective measurement (a scale) from formative measurement (an index), and explain why internal consistency applies only to a scale.
- 2.1 Describe levels of measurement, published scoring rules and cut-points, and explain what a cut-point gains and loses.
- 2.2 Explain why reverse-worded items are recoded according to the scoring manual, and recode, reverse-code and score the six De Jong Gierveld items in R.
- 3.1 State the classical test theory model, interpret a reliability value as the true-score share of observed-score variance, and explain how measurement error weakens a correlation.
1.1 The Vocabulary of Measurement
The lesson follows one running case, a manuscript on loneliness whose reviewer has raised two questions about how loneliness was measured. The case card below describes it, and each section of the lesson adds one part of the reply.
Amira, a graduate student, has written a manuscript on loneliness using the 2021 wave of the Canadian Social Connection Survey (CSCS). She measured loneliness with the six-item De Jong Gierveld Loneliness Scale and added the six items into a single score. Her manuscript has returned with this comment from the second reviewer: "The authors add the six De Jong Gierveld items into a single score. Do the items measure one construct or two? The emotional subscale has three items. Is it reliable enough to analyze on its own?" Each section of this lesson adds one part of Amira's reply. Section 1 prepares and scores the items, Section 2 estimates their reliability, Section 3 assembles evidence of validity, and Section 4 tests the structure of the scale and drafts the revised Measures paragraph.
Answering either question requires precise terms for the parts of a measure, because a reviewer will notice when a manuscript calls an index a scale or treats a single item as a construct. The terms are used with the following meanings throughout the course (Streiner, Norman & Cairney, 2015; DeVellis, 2017). A construct is the theoretical idea a study sets out to measure, such as loneliness. By this we mean that loneliness is not something that can be seen or counted directly, the way age or blood pressure can; it is an idea about an inner experience that researchers have defined in words. Because it cannot be observed, a construct is represented in statistical models by a latent variable, a variable whose values are never recorded in the data and are instead inferred from the answers people give. A domain is a distinct part of the construct. For example, a person can feel lonely because they lack one close confidant or because they lack a wider circle of friends, and these two experiences are treated as two domains of loneliness. An item is a single question with its response options, and the answer a person gives is an indicator of the construct, in the sense that it points toward, but does not by itself equal, the person's level of loneliness. The instrument is the complete questionnaire with its instructions and scoring rules. A scale combines the answers to several items into a score for one construct, a subscale does the same for one domain, and an index combines components that together define a construct.
Figure 7.1 shows how these terms connect for the De Jong Gierveld Loneliness Scale, from the construct at the top, through its two domains and six items, to the instrument and scoring rule at the bottom.
Each link in the chain has a fuller definition and an example from the CSCS. Click each of the six cards below to see how the term is used, for example which two domains Weiss (1973) described for loneliness and which other scales the CSCS instrument contains.
For any new questionnaire, the same chain can be traced from its description: what is being measured, what its parts are, which questions belong to which part, and how the answers are combined. Two of the terms, scale and index, describe measures that both combine several items into one number, and the next subsection explains why the difference between them decides which statistics can be used to judge a measure.
1.2 Scales and Indices: Reflective and Formative Measurement
A scale and an index rest on different models of how the items relate to the construct (Bollen & Lennox, 1991; Diamantopoulos & Winklhofer, 2001). In reflective measurement, the construct causes the answers. By this we mean that the person's level of loneliness comes first, and their answers to the items are a consequence of it. For example, a person who is lonely is more likely to report a sense of emptiness and more likely to report feeling rejected, because both answers flow from the same underlying experience. As a result, the answers to the items rise and fall together across people, and any one item could be replaced by a similar item without changing what is measured, since every item is simply another symptom of the same construct. In formative measurement, the direction is reversed: the components define the construct. A person is socially isolated because they are unmarried, rarely see family or friends and belong to no groups; isolation does not cause those circumstances, it is made up of them. This changes what we should expect from the data. Because nothing common causes the components, they can be unrelated to each other, and because each component is part of the definition, removing one changes the meaning of the index. A quick test is to ask whether having one component makes another more likely; if it does not, the measure is an index.
Figure 7.2 draws the two models side by side: the arrows run from the construct to the items in a reflective scale, and from the components to the construct in a formative index.
The three tabs below apply the distinction to three measures used in Canadian health research. Open each tab to compare the De Jong Gierveld scale, which is reflective, with an area deprivation index and the social isolation index in the CSCS file, which are formative.
The De Jong Gierveld Loneliness Scale (De Jong Gierveld & Van Tilburg, 2006) is reflective. Each item is a symptom of loneliness, so people who are lonelier are expected to give lonelier answers to every item. The items are interchangeable within a domain: "There are many people I can trust completely" and "There are enough people I feel close to" are two ways of asking about the same experience. Internal consistency, factor analysis and item response theory all assume this kind of model.
An area deprivation index, such as the Pampalon deprivation index used in Canadian health planning (Pampalon & Raymond, 2000), is formative. It combines census measures of education, employment and income with measures of household structure such as the share of people living alone. A neighbourhood is deprived because of these conditions, and the components need not move together: an area can have high employment and many people living alone. Each component is chosen because it is part of the definition, so dropping one changes what the index means.
The CSCS file contains the social isolation index of Steptoe and colleagues (2013), which gives one point each for being unmarried and not living with a partner, having less than monthly contact with children, with other family and with friends, and taking part in no groups or organizations. It is formative: a person who has no children is not thereby likely to belong to no clubs. Activity 7.2 in Section 2 shows that these components barely correlate, which is expected for an index and is no evidence against it.
The direction of the arrows matters because it decides how the quality of a measure is judged. The callout below states the rule, which returns in Section 2 when reliability is estimated.
Why the Distinction Matters for Analysis
Internal consistency statistics such as Cronbach's alpha (Section 2) measure how strongly the items of a scale move together. For a reflective scale, high correlations among items are expected, and low correlations suggest a problem. For a formative index, low correlations among components are normal, so an alpha computed for an index says nothing about its quality. The validity of an index is judged by whether its components cover the definition of the construct and whether the index relates to other variables as theory predicts.
A reflective scale and a formative index are therefore judged by different evidence. Either kind of measure must first be scored, and the next subsection turns to the levels of measurement and the scoring rules on which scoring depends.
2.1 Levels of Measurement, Scoring Rules and Cut-points
Before the answers to several items are combined, the analyst needs to know what kind of values the answers are and how the authors of the scale intended them to be scored. The first question concerns the level of measurement, and the second the scale's published scoring rule and any cut-point.
2.1.1 Levels of Measurement
Stevens (1946) described four levels of measurement. Nominal values are labels with no order, such as province of residence. Ordinal values have an order with unknown spacing, such as the answers "No", "More or less" and "Yes". Interval values have equal spacing without a true zero, such as temperature in degrees Celsius, and ratio values have equal spacing and a true zero, such as age or income. The level decides which summaries make sense: a mode for nominal values, a median for ordinal values, and means and differences for interval and ratio values.
Each De Jong Gierveld item is ordinal. A single Likert-type item is treated as ordinal because its few answers are ordered labels, and nothing shows that the steps from one answer to the next are equal. A sum of several ordinal items, however, is usually treated as approximately interval. By this we mean that analysts are willing to compute means of the total score and use it in linear regression, even though no single item has equal spacing. There are two reasons this works reasonably well. First, adding items spreads the scores over many possible values, so the total behaves more like a continuous measurement than any one item does. Second, the uneven spacing of each item's answers tends to average out across items: if one item has a large gap between two answers and another has a small gap, the total is not dominated by either. Because the justification depends on having many items and many possible values, the convention works well for long scales and is weaker when a score has only a few possible values, as the subscales here do (0 to 3), because a score with four possible values carries much of the uneven spacing of its items.
2.1.2 Scoring Rules and Cut-points
A published scale comes with a scoring rule, and the rule should be followed exactly so that scores can be compared with other studies. The De Jong Gierveld rule is dichotomous: each item scores 1 if the answer is "More or less" or the lonely answer, and 0 otherwise (De Jong Gierveld & Van Tilburg, 2006). The three emotional items are added to give the emotional subscale (0 to 3), the three social items give the social subscale (0 to 3), and the two subscales are added to give the total (0 to 6).
Some scales also publish a cut-point, a score at or above which a person is classified as having the condition. The CSCS file supplies a yes or no version of the total in which scores of 2 to 6 are classified as lonely. A cut-point gains a category that is easy to communicate, answers a question about how many people may need help and can be compared with other studies that use the same rule. It loses information, because it converts a score into a category: a person who scores 2 is treated the same as a person who scores 6, and scores of 1 and 2, which barely differ, fall in different groups. A cut-point should therefore be taken from the scale's documentation, stated in the manuscript, and used only when the research question needs a category.
The published rule gives a point for an answer of "More or less" or for the lonely answer on each item, so the lonely answer must be identified for every item. For three of the six De Jong Gierveld items the lonely answer is "No", and the next subsection explains how these items are recoded before they are combined.
2.2 Reverse-Worded Items and Scoring the Scale in R
Many scales mix negatively and positively worded items so that a respondent who agrees with every statement, a habit called acquiescence, does not receive an extreme score. The De Jong Gierveld scale does this. For the three emotional items ("I experience a general sense of emptiness", "I miss having people around me" and "I often feel rejected"), "Yes" is the lonely answer. For the three social items ("There are plenty of people I can rely on when I have problems", "There are many people I can trust completely" and "There are enough people I feel close to"), "No" is the lonely answer. Before the items can be combined, the positively worded items must be reverse-coded, as the scoring manual specifies, so that a higher number means a lonelier answer on every item.
Equation 7.1 gives the general rule for reversing the codes of an item, whatever the range of those codes.
Leaving a reverse-worded item unreversed is one of the most common errors in survey analysis. The item then counts in the wrong direction, the total score mixes loneliness with its opposite, and every statistic computed from it is distorted; Section 2 shows in R how much the reliability of the scale falls when this step is skipped. A cross-tabulation of the original and reversed codes is a quick check that the reversal worked: every 1 should become 3, every 2 should stay 2 and every 3 should become 1. A second check compares the finished total with the score supplied with the data, which tests every step at once.
Activity 7.1 puts these steps into practice and prepares the data used throughout the lesson. It loads the 2021 wave of the CSCS, converts the text answers of the six items to numbers, applies Equation 7.1 to the three social items and checks the reversal with a cross-tabulation, then applies the published scoring rule, draws the bar chart of total scores and checks the total against the supplied score. Run the script alongside the activity and answer its questions from your own output.
Text version of the activity: the code of the run-along script, its console output and notes on reading it.
github_url <- "https://raw.githubusercontent.com/jorgeandr3s/heal/main/cscs/public_data/CSCS2025_full_cleaned_deidentified_data_and_metadata.RData"
load(url(github_url))   # survey data, read from the web: a data frame called data
dim(data)               # rows (survey responses) and columns
data <- data[data$SURVEY_collection_year == 2021, ]   # one row per person
dim(data)The full file has 13,219 rows from several survey years. Keeping the 2021 wave leaves 4,045 people, one row per person, with the same 3,247 columns.
dj <- data.frame(
  emptiness = data$LONELY_dejong_emotional_social_loneliness_scale_emptiness,
  miss      = data$LONELY_dejong_emotional_social_loneliness_scale_miss,
  rejected  = data$LONELY_dejong_emotional_social_loneliness_scale_rejected,
  rely      = data$LONELY_dejong_emotional_social_loneliness_scale_rely,
  trust     = data$LONELY_dejong_emotional_social_loneliness_scale_trust,
  close     = data$LONELY_dejong_emotional_social_loneliness_scale_close)
table(dj$emptiness, useNA = "ifany")   # the answers are stored as text
table(dj$rely, useNA = "ifany")The answers are stored as text. Besides "Yes", "More or less" and "No", 27 people saw the emptiness item without answering it ("Presented but no response") and 536 were not shown it (NA). The order in which the categories print comes from the file and has no meaning.
lv <- c("No", "More or less", "Yes")        # match() gives each answer's place
dj$emptiness_n <- match(dj$emptiness, lv)   # any other answer becomes NA
dj$miss_n      <- match(dj$miss, lv)
dj$rejected_n  <- match(dj$rejected, lv)
dj$rely_n      <- match(dj$rely, lv)
dj$trust_n     <- match(dj$trust, lv)
dj$close_n     <- match(dj$close, lv)
table(dj$emptiness, dj$emptiness_n, useNA = "ifany") # checkmatch() gives the place of each answer in lv, so "No" becomes 1, "More or less" 2 and "Yes" 3; any other answer, such as "Presented but no response", becomes NA. The cross-tabulation is the check: each answer maps to exactly one number, and both kinds of missing answer are NA.
dj$rely_r  <- 4 - dj$rely_n
dj$trust_r <- 4 - dj$trust_n
dj$close_r <- 4 - dj$close_n
table(dj$rely_n, dj$rely_r) # check: 1 -> 3, 2 -> 2, 3 -> 1For the three social items "No" (code 1) is the lonely answer, so each is reversed with (maximum + minimum) − code = 4 − code. The table confirms the reversal for the rely item: the 546 people coded 1 now have 3, the 1,526 coded 2 stay at 2, and the 1,409 coded 3 now have 1, with no other cells filled.
items <- data.frame(emptiness = dj$emptiness_n, miss = dj$miss_n,
                    rejected = dj$rejected_n, rely = dj$rely_r,
                    trust = dj$trust_r, close = dj$close_r)
items <- na.omit(items)   # people who answered all six items
nrow(items)The items data frame holds the 3,415 people who answered all six items, with a higher code meaning a lonelier answer on every item. People coded "Presented but no response" were given NA by the recoding, so na.omit() removed them, together with the people who were not shown the items. Sections 2 and 4 analyze this data frame.
dj$emptiness_01 <- as.numeric(dj$emptiness_n >= 2)
dj$miss_01      <- as.numeric(dj$miss_n >= 2)
dj$rejected_01  <- as.numeric(dj$rejected_n >= 2)
dj$rely_01      <- as.numeric(dj$rely_r >= 2)
dj$trust_01     <- as.numeric(dj$trust_r >= 2)
dj$close_01     <- as.numeric(dj$close_r >= 2)
A comparison such as dj$emptiness_n >= 2 gives TRUE or FALSE, and as.numeric() turns TRUE into 1 and FALSE into 0. For "There are enough people I feel close to", the reversed code is 3 for "No" and 2 for "More or less", so dj$close_r >= 2 gives those two answers a point and "Yes" none.
dj$emotional_score <- dj$emptiness_01 + dj$miss_01 + dj$rejected_01
dj$social_score    <- dj$rely_01 + dj$trust_01 + dj$close_01
dj$total_score     <- dj$emotional_score + dj$social_score
table(dj$total_score, useNA = "ifany")
barplot(table(dj$total_score), col = "grey80",
        xlab = "Total score (0 = not lonely, 6 = most lonely)",
        ylab = "Number of participants")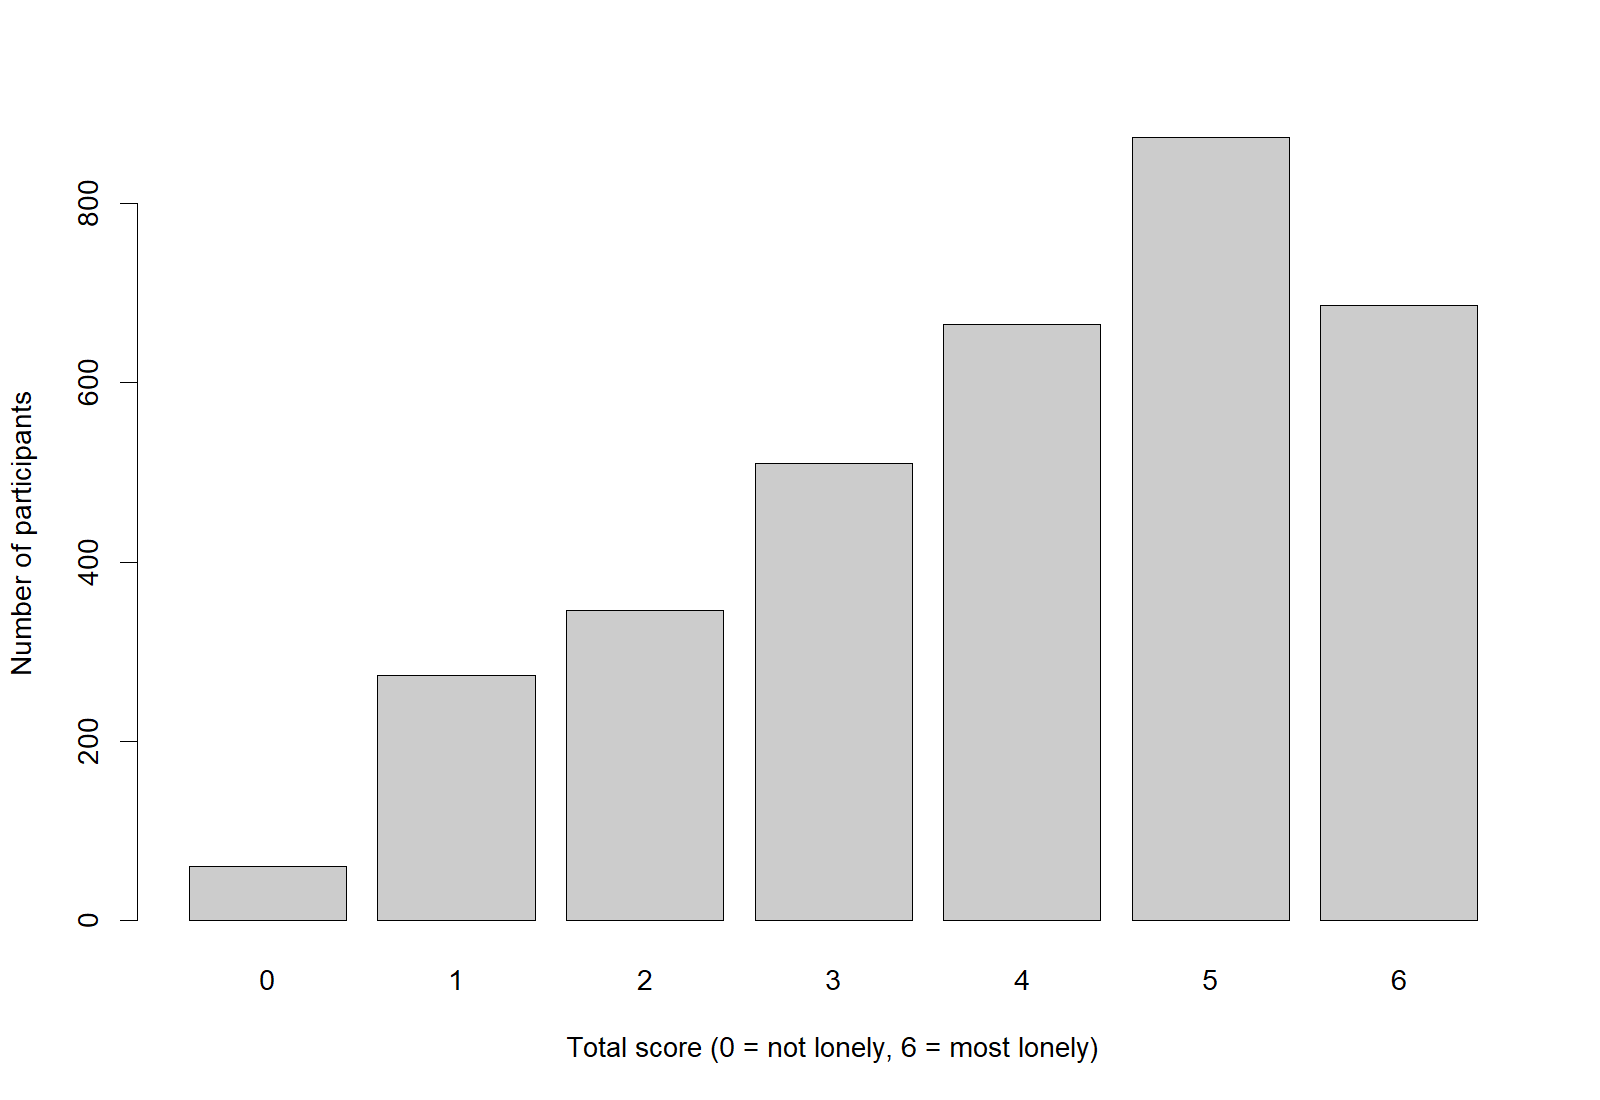
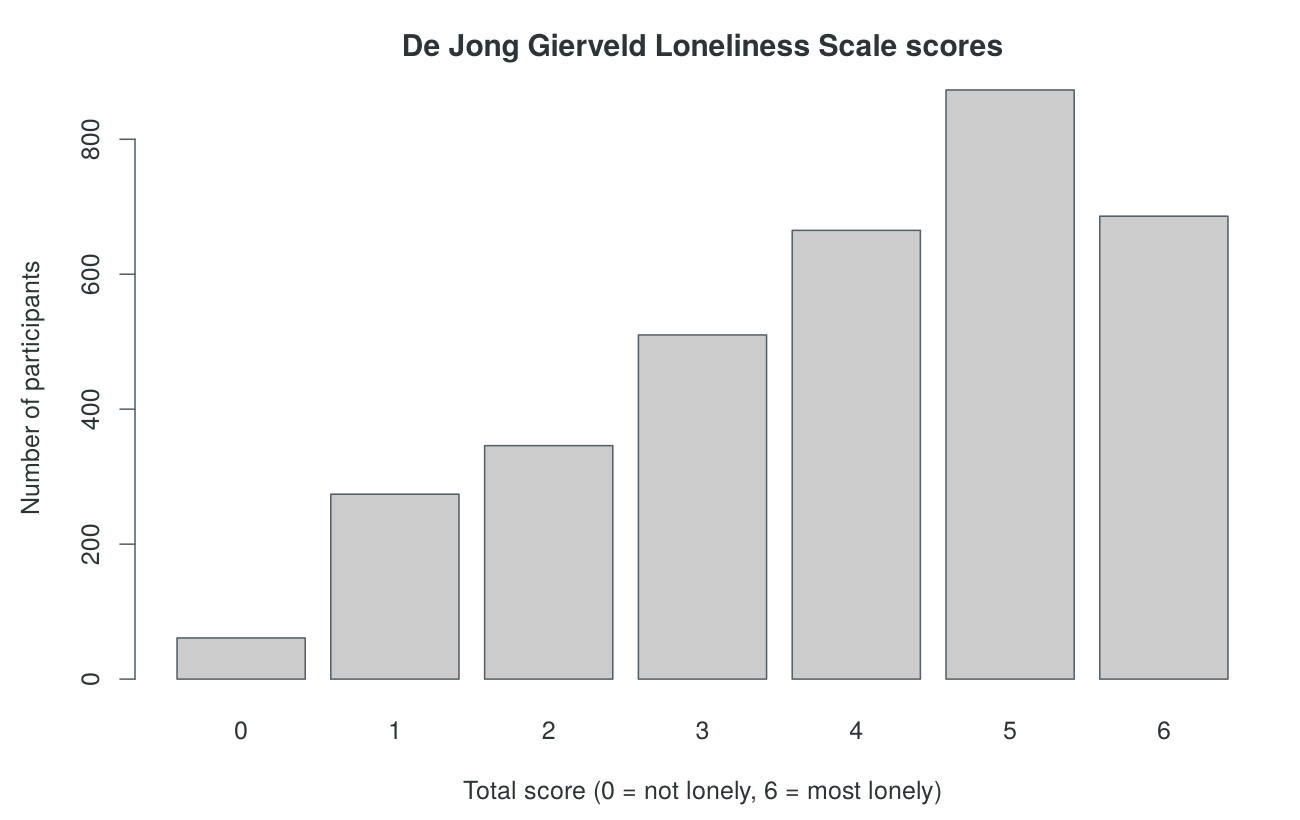
The table shows the total score for the 3,415 people with complete answers; the 630 people with any missing item have no total. Scores pile up toward the lonely end: 873 people score 5 and 686 score 6. Each item is ordinal, so adding the item scores treats the sum as approximately interval, a convention that is weaker for a subscale that can take only four values (0 to 3).
supplied <- data$LONELY_dejong_emotional_social_loneliness_scale_score
table(dj$total_score == supplied, useNA = "ifany")All 3,415 totals equal the score supplied with the data, and the 630 NA values are the same people in both versions. This one comparison checks the recoding, the reversal and the scoring rule at once.
R Reflect on what you just ran
Answer each question from your own output, as on the final exam: find the number, say what it means, judge the check.
1. Why does the De Jong Gierveld scale mix negatively and positively worded items, and why must rely, trust and close be reverse-coded before the six items are added? What does the table from table(dj$rely_n, dj$rely_r) show?
rely, trust and close, "No" (code 1) is the lonely answer, whereas "Yes" is the lonely answer on the emotional items; left unreversed, these three items would count in the wrong direction, the total would mix loneliness with its opposite, and every statistic computed from it would be distorted. The scoring manual therefore has them reverse-coded with (maximum + minimum) − original code, which for codes 1 to 3 is 4 − the code, so that a higher code means a lonelier answer on every item. The table shows that every original code maps to exactly one reversed code: the 546 people coded 1 now have 3, the 1,526 coded 2 stay at 2 and the 1,409 coded 3 now have 1, with no other cells filled, so the reversal worked.2. Run your own code: the CSCS file classifies total scores of 2 to 6 as lonely. At the end of your script, type and run table(dj$total_score >= 2) and round(100 * prop.table(table(dj$total_score >= 2)), 1), which print how many of the 3,415 people have a total of 2 or more (TRUE) and what percentage that is. Report the result in one sentence, and give one advantage and one cost of reporting this category rather than the score.
TRUE and 335 for FALSE, and 90.2% and 9.8%: 3,080 of the 3,415 people (90.2%) have totals of 2 to 6 and are classified as lonely. Advantage: a category is easy to communicate, answers a question about how many people may need help, and can be compared with other studies that use the same rule. Cost: it discards information, treating a score of 2 the same as a score of 6 and placing scores of 1 and 2, which barely differ, in different groups. The cut-point should come from the scale's documentation, be stated in the manuscript and be used only when the research question needs a category.3. Run your own code: at the end of your script, type skip <- dj$emotional_score + (dj$rely_n >= 2) + (dj$trust_n >= 2) + (dj$close_n >= 2) and run it; it scores the three social items as they were stored, without the reversal. Then type table(skip == supplied, useNA = "ifany") and run it. A colleague says that once the scoring code runs without an error, there is no need to check the total against the score supplied with the data. Use this table and the one from line 66 to respond.
Figure 7.3 reproduces the bar chart of total scores that Activity 7.1 draws.
The six items are now coded in the same direction and scored by the published rule, the totals match the score supplied with the data, and Figure 7.3 shows that the total scores are skewed toward the lonely end of the scale. Even a correctly prepared score contains some error, and the next subsection introduces the model that classical test theory uses to describe it.
3.1 Classical Test Theory and Measurement Error
Classical test theory describes what an observed score contains and defines reliability. It also predicts what random error does to the associations estimated with a score, which is why the reliability of each subscale matters for Amira's results.
3.1.1 The Classical Test Theory Model
Classical test theory, set out formally by Lord and Novick (1968), is the simplest model of what an observed score contains. It states that each person's observed score X is the sum of a true score T and a random error E. The true score is the average score the person would obtain over many hypothetical repetitions of the measurement under the same conditions. By this we mean that if Amira could ask the same person the six loneliness items again and again, without the person remembering earlier answers or changing in the meantime, their scores would vary a little from one occasion to the next, and the average of all those scores would be their true score. The error is the difference between any one observed score and that average: a question misread, a passing mood, a guess between two answers. The model makes three assumptions about this error. Errors average zero, so they push some scores up and others down without a consistent direction. They are unrelated to the true score, so lonelier people are not more prone to error than less lonely people. And the errors of different measurements are unrelated to each other, so a person's bad day on the loneliness items does not also distort their answers on a depression scale. Because of these assumptions, error in this model is purely random, and the model says nothing about systematic error, which is a question of validity (Section 3).
Equation 7.2 states the model and the definition of reliability that follows from it.
A reliability of 0.80, for example, means that 80% of the variance in observed scores reflects real differences between people and 20% is random error. Notice that reliability is defined as a ratio of two variances, and a variance describes how much people differ from each other. Reliability is therefore a property of scores in a population, not a fixed property of the questionnaire, and it depends on how much people in that population differ. For example, suppose the same scale, with the same amount of random error in each answer, is given to two populations. In a population with a wide range of loneliness, the true-score variance is large, so the error makes up a small share of the total variance and reliability is high. In a population in which almost everyone is equally lonely, the true-score variance is small, so the same amount of error makes up a much larger share and reliability is lower. For this reason a manuscript reports the reliability observed in its own sample as well as the value from the scale's original publication.
3.1.2 Measurement Error Weakens Associations
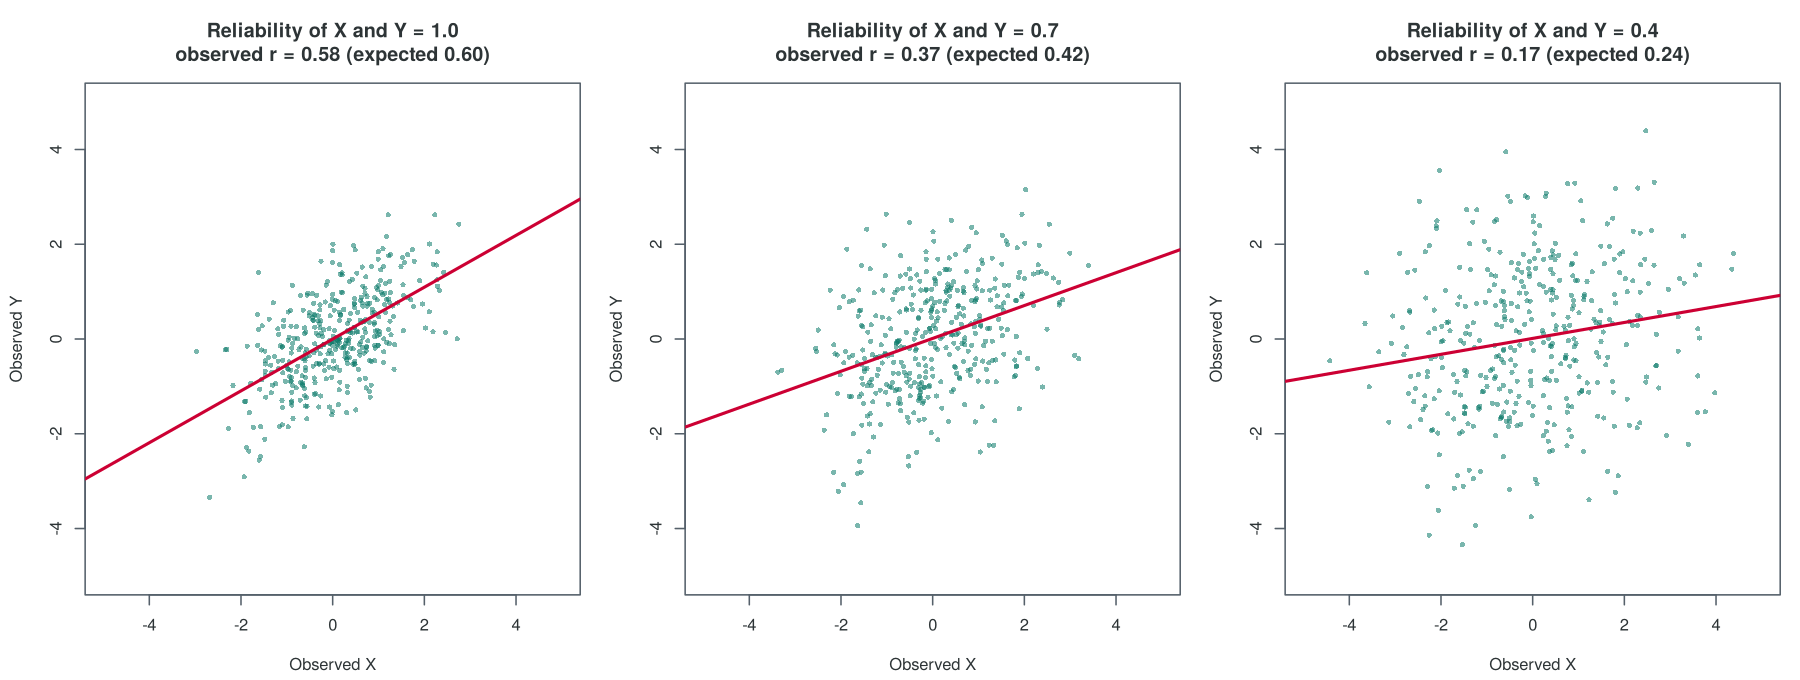
Random measurement error has a predictable effect on correlations. Spearman (1904) showed that when two variables are measured with error, the correlation between the observed scores is smaller than the correlation between the true scores, a result called attenuation. Equation 7.3 gives Spearman's formula for the size of this effect.
The reason for the weakening is that random error adds variation to each score that has nothing to do with the other variable. When a lonely person happens to score lower than their true score on one occasion, that error is not matched by a corresponding error in their depression score, so the points in a scatter plot spread out and the observed relationship looks looser than the true one. Notice also that the formula contains the two reliabilities but not the sample size. This means that a larger sample does not remove the weakening. A larger sample makes the observed correlation a more precise estimate, but it is a more precise estimate of the weakened value, because random error pulls the observed correlation toward zero however many people are measured. The formula can also be run in reverse. Dividing an observed correlation by √(relX × relY), for example with a line such as r_obs / sqrt(rel_x * rel_y) in R, estimates the correlation between the true scores, which is always at least as large as the observed one.
The corresponding result for a regression slope is simpler, but it depends on which variable contains the error. When the exposure is measured with random error, the observed slope equals the true slope multiplied by the reliability of the exposure, a factor called the regression dilution ratio. By this we mean that the slope is shrunk toward zero by the same proportion as the exposure's reliability: with an exposure reliability of 0.60, a true slope of 2.0 is observed as about 1.2. This happens because the error stretches the exposure along the horizontal axis without any matching change in the outcome, which flattens the fitted line. Random error in the outcome behaves differently. In a regression the outcome already has a residual term, and random error in the outcome is simply added to that residual. As a result, it leaves the slope unbiased, but because the residual variance is larger, it widens the confidence interval around the slope.
Interactive 7.1 lets you watch attenuation happen. It generates 250 people whose true loneliness and true depressive symptoms have a chosen correlation, then adds random error to each measure. Move the sliders to lower the reliability of either measure and watch the cloud of points spread and the observed correlation fall toward zero; the panel also reports the correlation expected from Equation 7.3, so that the simulated and expected values can be compared.
📊 Interactive 7.1: Simulation: watch a correlation weaken as measurement error grows
The same weakening applies to the associations in Amira's manuscript, as the case card below explains.
Amira's manuscript reports a correlation between loneliness and depressive symptoms. If the emotional subscale has a reliability of about 0.5, as Section 2 will show, then Equation 7.3 implies that even a strong true association with a perfectly measured outcome would appear in her data at only about 0.71 of its true size, the square root of 0.5 (sqrt(0.5) in R). A weak or null finding for the emotional subscale could therefore reflect the measure as much as the world. This is the practical reason that the reliability of each subscale must be reported, and that a low value must be discussed when the subscale is analyzed on its own.
This section has defined the parts of a measure, separated reflective scales from formative indices, prepared and scored the six De Jong Gierveld items, and introduced the classical test theory model, in which reliability is the proportion of observed-score variance that is true-score variance and random error weakens associations. Because true scores are never observed, reliability has to be estimated from data, which is the task of Section 2. The key takeaways below draw the section together before its knowledge check.
Key Takeaways
- 1.1 Every score you analyze sits at the end of a chain that starts with an idea. The construct is the idea a study sets out to measure, such as loneliness, and because it cannot be observed directly it is represented in models by a latent variable. A domain is a distinct part of the construct (emotional and social loneliness), an item is a single question with its response options, and the answer a person gives is an indicator of the construct; the instrument is the whole questionnaire with its instructions and scoring rules, and a scale (or a subscale, for one domain) combines items into a score. In the running case, the six De Jong Gierveld items form two three-item subscales that add up to a total from 0 to 6. When a question describes a new questionnaire, work down the chain and name each link from the question text: what is being measured, what its parts are, which questions belong to which part, and how the answers are combined. Keep the word "index" for a measure whose components define the construct rather than reflect it, which the next takeaway explains.
- 1.2 Scales and indices both turn several items into one number, but they work in opposite directions, so the first question to ask is which way the arrows run. In a reflective scale the construct causes the answers: a lonelier person is more likely to report a sense of emptiness and more likely to feel rejected, so the items rise and fall together. In a formative index the components define the construct: a person counts as socially isolated because they are unmarried, rarely see friends and belong to no groups, and these circumstances need not be related to each other. The items of a reflective scale are expected to correlate, whereas the components of a formative index need not, so internal consistency applies only to scales. A quick test on an exam is to ask whether having one component makes another more likely (does caring for a grandchild make a person more likely to belong to a club?); if not, you are looking at an index, and low correlations among its components are expected rather than a sign of a problem.
- 2.1 Before you combine answers, you need to know what kind of values they are and how the scale's authors meant them to be scored. A single item with a few ordered answers, such as "No", "More or less" and "Yes", is ordinal, because nothing shows that the steps between answers are equal; a sum of several items is usually treated as approximately interval, an assumption that is weaker when a score has only a few possible values, like the 0 to 3 subscales. Follow the published scoring rule exactly so that your scores can be compared with other studies: for the De Jong Gierveld scale, each item scores 1 for "More or less" or the lonely answer and 0 otherwise. A cut-point turns the score into a category (in the CSCS, totals of 2 to 6 count as lonely), which is easy to report and useful when the research question needs a category, but it discards information, because a person who scores 2 is treated the same as a person who scores 6. When a question asks what a cut-point gains and loses, give one of each in exactly that form, and add that the cut-point should be taken from the scale's documentation and stated in the manuscript.
- 2.2 Many scales mix negatively and positively worded items so that a person who agrees with every statement (acquiescence) does not receive an extreme score, which means some items must be flipped before you add them up. Reverse-worded items must be recoded according to the scoring manual before items are combined. Decide which items to flip from the item wording and the manual, then apply one rule that works for any range of codes: the reversed code is (maximum + minimum) minus the original code, so on items coded 1 to 3 you subtract from 4 (as
4 - dj$rely_ndoes), and on items coded 1 to 5 you subtract from 6, so a 1 becomes 5 and a 4 becomes 2. If you skip this step, the unreversed items count in the wrong direction, the total mixes the construct with its opposite, and every statistic computed from the score is distorted. Always check the result with a cross-tabulation such astable(dj$rely_n, dj$rely_r): every 1 should become 3, every 2 should stay 2, every 3 should become 1, and no other cells should be filled. - 3.1 Classical test theory gives you a simple way to think about what any score contains: the observed score X is a true score T plus a random error E, where the error is everything that varies from one measurement to the next, such as a misread question or a passing mood. Reliability is the share of the variance in observed scores that is true-score variance, so it runs from 0 (all error) to 1 (no error), and a reliability of 0.80 means that 80% of the variance in observed scores reflects real differences between people and 20% is random error. Because it depends on how much people in a population differ, reliability belongs to scores in a particular sample, which is why a manuscript reports the value found in its own sample. Random error also weakens associations: when two measures are unreliable, the observed correlation is smaller than the correlation between the true scores (attenuation), and Spearman's formula gives the observed correlation as the true correlation times √(relX × relY). So if a question asks whether the true correlation is likely to be higher or lower than the one observed with imperfect scores, the answer is higher, and a weak or null finding with an unreliable measure may reflect the measure as much as the world.
1. A research team describes its new Caregiver Strain Questionnaire as follows: "Caregiver strain has two parts, physical strain and emotional strain. Ten statements, five for each part, are answered from 0 (never) to 3 (often). The answers to each set of five statements are added to give two scores, and the two scores are added to give a total." Which sentence uses the vocabulary of measurement correctly?
2. A researcher builds a household food insecurity measure by adding one point each for low household income, having no vehicle and living more than 2 km from a grocery store. The three components correlate only 0.05 to 0.15 with one another, and a colleague says that this shows the measure is poorly built. Which response is best?
3. A five-item stress scale is answered from 1 (never) to 5 (very often). Items 2 and 4 are worded positively (for example, "I felt on top of things") so that people who agree with every statement (acquiescence) do not receive extreme scores. The scoring manual says to reverse-code items 2 and 4, add the five items (5 to 25), and classify a score of 18 or more as high stress. An analyst scores the scale in R and prints the row for participant 17. Which statement is correct?
> d$s2_r <- 6 - d$s2          # reverse-code item 2
> d$s4_r <- 6 - d$s4          # reverse-code item 4
> d$total <- d$s1 + d$s2_r + d$s3 + d$s4_r + d$s5
> d$high <- d$total >= 18     # published cut-point
> d[17, c("s1","s2","s3","s4","s5","s2_r","s4_r","total","high")]
   s1 s2 s3 s4 s5 s2_r s4_r total high
17  4  2  5  1  3    4    5    21 TRUE
6 - lines do. The printed row confirms that the reversal worked (the answer of 2 to item 2 is now 4 and the answer of 1 to item 4 is now 5), and R prints a total of 21 with high = TRUE, so the participant is at or above the cut-point. Option a adds the answers as stored, so the two positively worded items would count in the wrong direction, and option b uses 5 minus the code, which turns a 1 into 4 instead of 5. A cut-point gives a category that is easy to report and to compare with other studies, but it discards the differences in degree within each category, which is why option d is wrong. (Section 1, 2.1 Levels of Measurement, Scoring Rules and Cut-points and 2.2 Reverse-Worded Items and Scoring the Scale in R, Equation 7.1 and Activity 7.1; Objectives 2.1 and 2.2)4. A study reports that its depression score has a reliability of 0.75 in its own sample. A student is asked what this value means. Which interpretation is correct?
5. In a survey, the observed correlation between a loneliness score and a sleep-quality score is 0.36. The loneliness score has a reliability of 0.90 and the sleep-quality score has a reliability of 0.40. An analyst rearranges Spearman's attenuation formula in R to estimate the correlation between people's true levels of loneliness and sleep quality. Which interpretation is correct?
> 0.36 / sqrt(0.90 * 0.40)
[1] 0.6
Reliability
Overview
Section 1 defined reliability as the proportion of the variance in observed scores that is true-score variance. This definition cannot be applied directly, because true scores are never observed. Reliability is therefore estimated from the consistency of a measurement: across two occasions, across two raters, or across the items of a scale. This section first sets out two conditions that must hold before the consistency of a set of items is worth estimating: the measure must be a scale rather than an index, and its items must be coded as the scoring manual says. It then describes the three kinds of reliability and the design that each requires, and teaches the most widely reported reliability statistic, Cronbach's alpha, together with its assumptions, its limits and its main alternative, McDonald's omega. Together these answer the second question in the reviewer's comment: whether the emotional subscale of the De Jong Gierveld scale is reliable enough to analyze on its own.
Learning Objectives
- 1.3 Explain why alpha should not be reported for a formative index.
- 2.3 Recognize a missed reversal in
psych::alpha()output, and explain why the scoring manual, notcheck.keys = TRUE, decides which items are reversed. - 3.2 Compare test-retest, inter-rater and internal consistency reliability, and state which can be estimated from a single cross-sectional survey.
- 3.3 Interpret an intraclass correlation for test-retest reliability and Cohen's kappa for agreement between two raters, including why a shift between occasions lowers the intraclass correlation and a rare category lowers kappa.
- 4.1 Read Cronbach's alpha, corrected item-total correlations (
r.drop) and alpha-if-item-deleted frompsych::alpha(), and judge whether a reliability is adequate for comparing groups or for decisions about individuals. - 4.2 Explain the assumptions and limits of alpha, including why a high alpha does not show that a scale is unidimensional.
- 4.3 Explain how McDonald's omega relaxes the equal-loadings assumption of alpha, and decide what to do about a weak item.
1.3 Internal Consistency Applies Only to Scales
A single survey such as the CSCS supports one kind of reliability, internal consistency: the degree to which the items of a measure move together on one occasion (3.2 explains why). Every internal consistency statistic, including Cronbach's alpha (4.1) and McDonald's omega (4.3), assumes the reflective model of Section 1, in which one construct causes all of the answers, so that the items are expected to correlate. The statistics therefore make sense only for a scale.
The components of a formative index define the construct and are not expected to correlate, so a low internal consistency for an index is expected and says nothing about its quality. The CSCS file contains such an index, the social isolation index of Steptoe and colleagues (2013), which gives one point each for being unmarried and not living with a partner, having less than monthly contact with children, with other family and with friends, and taking part in no groups or organizations. Activity 7.2, at the end of this section, shows that its five components correlate only between −0.10 and 0.36 and give an alpha of 0.34 for the 3,430 people with all five components. That value is printed only to show why it should not be reported as the reliability of the index. Omega would be equally out of place, because it also rests on a model in which one factor causes every answer. An index is judged instead by whether its components cover the definition of the construct and whether it relates to other variables as theory predicts.
When a low alpha is reported for a measure built by adding yes or no components, the first step is therefore to decide whether the measure is an index, and if it is, to say that alpha does not apply rather than to call the measure unreliable. The second condition concerns how the items of a scale are coded, which the next subsection takes up.
2.3 Spotting a Missed Reversal: The Scoring Manual Decides
Section 1 reverse-coded the three positively worded De Jong Gierveld items, as the scoring manual requires. If that step is skipped, three items count in one direction and three in the other, and every reliability statistic computed from the items is distorted: Activity 7.2 shows the six-item alpha falling from 0.59, with the correct coding, to 0.42 when rely, trust and close are left as they were stored.
The alpha() function in the psych package leaves three signs of a missed reversal, and they are worth looking for together. First, it prints a note and a warning that some items "probably should be reversed". Second, its item statistics include the corrected item-total correlation, printed as r.drop, which is the correlation of each item with the sum of the other items. A negative r.drop means that the item moves in the opposite direction to the rest of the scale: people who score high on the other items tend to score low on it. When that item is worded in the opposite direction to the others, the usual explanation is that it has not been reverse-coded. Third, alpha is lower than it should be. The remedy is to check the scoring manual, reverse-code the item if the manual says so, and recompute alpha, rather than to drop the item.
The warning also suggests rerunning alpha() with the option check.keys = TRUE, which flips every flagged item automatically. This option is tempting, but it should not be used to decide which items to reverse. The reason is that the software cannot read the wording of the items, so it cannot tell which ones are worded in the opposite direction. Instead, it works only from the numbers. It finds the first principal component of whatever data it is given, which is roughly the single direction along which the items vary together most, and it flags any item that correlates negatively with that direction. A miscoded item will usually be flagged, but so can an item that is correctly coded and merely relates weakly or inconsistently to the others. Even in the correctly coded CSCS data, psych warns that miss ("I miss having people around me") is negatively correlated with the first principal component, and check.keys = TRUE would reverse an item that is correctly coded and simply weak. The scoring manual, not check.keys = TRUE, decides which items are reversed. A negative r.drop for an oppositely worded item points to a coding error, whereas a low positive r.drop points to a weak item, which 4.1 describes.
With the measure confirmed as a scale and its items coded as the manual says, the next question is which kind of reliability the study design allows Amira to estimate.
3.2 Three Kinds of Reliability
Every reliability statistic measures consistency, and the kinds of reliability differ in what the consistency is across. The choice is driven by the main source of error in the measurement: the occasion on which it is made, the person who makes it, or the particular items used. Test-retest reliability asks whether the same people get similar scores on two occasions, inter-rater reliability asks whether two observers who rate the same people agree, and internal consistency asks whether the items of one scale move together on a single occasion.
Table 7.1 sets out the three kinds of reliability, the question each one answers, the design it needs and the statistic usually reported. When a study is described, its design decides which row applies.
Table 7.1. Three kinds of reliability, with the design and the usual statistic for each.
| Kind of reliability | Question it answers | Design needed | Usual statistic |
|---|---|---|---|
| Test-retest | Do the same people get similar scores on two occasions? | The measure is given twice, with an interval short enough that the construct has not changed (often one to four weeks). | Intraclass correlation coefficient (ICC) for scores; kappa for categories |
| Inter-rater | Do two observers give the same rating to the same person? | Two or more raters assess the same people independently. | Cohen's kappa for categories; ICC for scores |
| Internal consistency | Do the items of one scale move together on one occasion? | One administration of a multi-item scale. | Cronbach's alpha; McDonald's omega |
The design column is the one to read first, because a study can estimate only the kinds of reliability that its design supports. The callout below applies the table to the CSCS.
What the CSCS Can and Cannot Show
The 2021 wave of the CSCS asked the loneliness items once, in a self-completed online questionnaire with no interviewer or rater. Amira can therefore estimate internal consistency in her own sample, but she cannot estimate test-retest or inter-rater reliability. Evidence on the stability of the De Jong Gierveld scale over time has to come from the published literature on the scale, and her Measures paragraph should cite it as such and make clear which statistics were computed in her sample.
Although the CSCS cannot estimate them, test-retest and inter-rater reliability are reported for many instruments, and the next subsection explains how their two usual statistics are read.
3.3 The Intraclass Correlation and Cohen's Kappa
Test-retest reliability for a continuous score is usually summarized with an intraclass correlation, and agreement between two raters on categories with Cohen's kappa. Both statistics are read from R output, and each has one feature that is easy to misread.
3.3.1 The Intraclass Correlation for Test-Retest Reliability
The intraclass correlation coefficient (ICC) measures agreement as well as correlation. A Pearson correlation between two occasions can be high even if everyone scored five points higher the second time, because it asks only whether people keep the same rank order, whereas the intraclass correlation for absolute agreement asks whether people receive the same score twice and so counts such a shift as disagreement. In practice the intraclass correlation is read from R output: the ICC() function in the psych package prints it with a 95% confidence interval. Equation 7.4, the intraclass correlation for absolute agreement, is given in Worked Example 7.1 to show what the value compares.
Worked Example 7.1 applies the intraclass correlation to hypothetical scores for six people measured on two occasions, first as observed and then after a uniform shift in the second set of scores. Watch how the Pearson correlation and the ICC respond differently to the shift.
Worked Example 7.1: A test-retest intraclass correlation
Six people complete a symptom scale scored 0 to 20 on two occasions two weeks apart (hypothetical data). The intraclass correlation for absolute agreement compares the variation between people with the variation that remains: the disagreement between occasions for the same person, and any systematic shift from one occasion to the other.
| Person | A | B | C | D | E | F |
|---|---|---|---|---|---|---|
| Occasion 1 | 4 | 7 | 9 | 12 | 14 | 17 |
| Occasion 2 | 5 | 6 | 10 | 11 | 15 | 16 |
Both occasions have a mean of 10.5, so there is no shift between them (MSC = 0), and the people differ far more from each other than each person's two scores differ. For these scores, the ICC() function in the psych package reports an intraclass correlation for absolute agreement (the ICC2 row) of 0.98, and cor() gives a Pearson correlation of 0.97. Now suppose that every person scores 4 points higher on the second occasion. The Pearson correlation is unchanged at 0.97, because it ignores a shift that is the same for everyone. The shift enters Equation 7.4 through MSC, which rises from 0 to 48.0, and ICC() now reports 0.71, because people no longer receive the same score twice.
Koo and Li (2016) suggest reading an ICC below 0.50 as poor reliability, 0.50 to 0.75 as moderate, 0.75 to 0.90 as good and above 0.90 as excellent, preferably judged from its 95% confidence interval. The first version of the table shows excellent test-retest reliability and the shifted version moderate reliability. This intraclass correlation coefficient is a different application of the same kind of variance ratio as the intracluster correlation coefficient used for clustered data: there the clusters are clinics or people measured repeatedly, and here the repeated measurements of each person are the subject of interest.
The worked example shows why an ICC is the statistic for test-retest agreement: the shift left the Pearson correlation untouched but moved the ICC from excellent to moderate. Test-retest reliability also assumes that the construct itself did not change between the occasions. If something happens between them that changes people's true scores, for example an event that raises everyone's worry, part of the shift is real change rather than error, and the ICC then understates the stability of the measure. The timing of the two occasions should therefore be checked whenever a mean change between them is reported.
3.3.2 Cohen's Kappa for Agreement Between Raters
Inter-rater reliability for categories, the second row of Table 7.1, is usually summarized with Cohen's kappa, which R gives with the cohen.kappa() function in the psych package. When two raters classify the same people into categories, the proportion of people on whom they agree (the observed agreement, po) overstates their reliability, because some agreement would occur by chance. Kappa corrects for this using the expected chance agreement, pe, which is calculated from each rater's own proportions in each category. Equation 7.5 gives the formula.
Suppose two interviewers each classify the same 100 participants as lonely or not lonely. Both say lonely for 20 and not lonely for 65, so they agree on 85% of participants. The first interviewer calls 30% of participants lonely and the second 25%, which gives a chance agreement of 0.60. By this we mean that two interviewers who assigned labels at random, but in those same proportions, would still agree on about 60% of participants simply because both say "not lonely" most of the time. Kappa asks how much of the remaining room for agreement above chance the interviewers actually achieved, and cohen.kappa() returns a kappa of 0.625. A rare category lowers kappa further. This is because, when almost everyone is placed in the common category, two raters will agree on most people even if they are guessing, so chance agreement is high and there is little room left above it. If each interviewer calls only 6% of participants lonely and they agree on 92 of 100, the chance agreement is already 0.887 and kappa is only 0.29, although agreement looks high. Kappa is therefore always lower than the raw percentage agreement, and much lower when one category is rare.
Internal consistency remains the only kind of reliability that Amira can estimate from the CSCS. The next subsection introduces the statistic most often used to estimate it, Cronbach's alpha.
4.1 Cronbach's Alpha and the Item Statistics
Cronbach's alpha is the most widely reported estimate of internal consistency. The recall callout below returns to the alpha analysis from Lesson 2 and poses a retrieval question; try to answer it before revealing the answer, which the standardized formula in this subsection makes exact.
Recall: Lesson 2, Section 3 (Building Scales)
The R activity in Lesson 2, Section 3 computed Cronbach's alpha for the seven depression items of the course dataset (alpha = 0.904), together with the alpha-if-item-deleted values and the corrected item-total correlations (r.drop, from 0.65 to 0.74). Every alpha-if-item-deleted value was below 0.904, so every item contributed. This section adds the formula behind alpha, its standardized form and McDonald's omega, and applies them to the De Jong Gierveld items.
Retrieval question. Why does alpha rise when items are added to a scale, even when the new items correlate with the others no more strongly than the existing items do?
Cronbach (1951) introduced coefficient alpha as a lower bound to the reliability of a sum of items, and it remains the statistic that reviewers most often expect to see. By a lower bound we mean that, under the classical test theory assumptions, the true reliability of the total score is at least as high as alpha, so alpha errs on the side of caution. Alpha works by comparing the variances of the individual items with the variance of the total score. The idea behind this comparison is that the variance of a sum depends on whether its parts move together. When the items move together, people who score high on one item tend to score high on the others, so their high answers pile up in the total while low scorers' low answers pile up too. The totals are then spread much more widely than the item variances alone would produce, and alpha approaches 1. When the items are unrelated, a high answer on one item is as likely to be paired with a low answer as with a high one, so the answers partly cancel out in the total. The variance of the total is then close to the simple sum of the item variances, and alpha approaches 0.
Equation 7.6 gives alpha in its raw form, computed from the variances of the items and of the total score, and in its standardized form, computed from the average correlation between pairs of items.
alpha() in Activity 7.2 prints an average_r of 0.5 and a std.alpha of 0.75; for the three emotional items, an average_r of 0.25 gives a std.alpha of 0.50.The standardized formula shows that alpha depends on two things: the number of items and the strength of their correlations. Three items with an average correlation of 0.25 give an alpha of 0.50, but the same formula gives 0.80 for twelve items with the same average correlation. Short subscales therefore tend to have lower alphas than long scales, even when their items are of equal quality, which is part of the reason the three-item emotional subscale has a low value.
Several conventions are used to judge alpha, and each ties the value to a use. Nunnally (1978) suggested that about 0.70 suffices in the early stages of research, that about 0.80 is adequate for basic research comparing groups, and that 0.90 or higher is needed when scores are used to make decisions about individuals, such as a clinical cut-point; the widely used minimum of 0.70 comes from the first of these. Very high values, above about 0.90 to 0.95, can indicate that some items are close paraphrases of each other, which adds length without adding information (Streiner, 2003). These conventions are guides for judgement, and a manuscript should report the value and its confidence interval and let readers judge it in context.
Three parts of the alpha() output carry most of the information. The first line gives raw_alpha, with its 95% confidence interval below it; the "Reliability if an item is dropped" table shows what alpha would become without each item; and the r.drop column of the item statistics gives the corrected item-total correlations introduced in 2.3. In Activity 7.2, the social subscale has an alpha of 0.75 (Feldt 95% confidence interval 0.74 to 0.77), and dropping any one of its items would lower alpha, so every item contributes. The emotional subscale has an alpha of 0.51.
The item statistics also identify a weak item. A low positive r.drop (for example below about 0.3), together with an alpha that rises when the item is dropped, marks an item that relates only loosely to the others. In the emotional subscale, miss has an r.drop of 0.16, against 0.43 and 0.40 for the other two items, and alpha would rise from 0.51 to 0.64 without it. The table of response frequencies at the bottom of the output can show why an item is weak. When most people give the same answer, for example when two-thirds answer "never", the item has a floor effect (a ceiling effect when most give the top answer), so it separates people only at one end of the trait and correlates weakly with the other items. Whether such an item should be dropped is taken up in 4.3.
Reading these values correctly also requires knowing what alpha assumes and what it cannot show, which the next subsection examines.
4.2 What Alpha Assumes and What It Cannot Show
Alpha is easy to compute and is often over-interpreted (Sijtsma, 2009; Dunn, Baguley & Brunsden, 2014). Three limits matter most. Because alpha rises with the number of items, a long scale built from two related clusters of items can reach 0.80 or more, so a high alpha cannot show that a scale is unidimensional; that is a question for factor analysis (Section 4). A higher alpha is not always better, because values above about 0.95 usually mean that items repeat each other. And a reliable score is not thereby valid, because reliability concerns random error, not whether the score measures the intended construct.
The accordion below sets out five common misconceptions about alpha, each with the evidence from the CSCS loneliness items; two of them restate the points of 1.3 and 2.3 in the form a reviewer might raise them. Expand each panel in turn. The first panel also contains a callout that examines a common claim about alpha and asks you to rewrite it.
Alpha measures how strongly the items correlate on average, and a set of items can correlate on average even when they measure two or more constructs. Because alpha rises with the number of items, a long scale built from two distinct clusters can reach 0.80 or more. In the CSCS data the six De Jong Gierveld items have an alpha of 0.59, lower than the 0.75 of the three social items alone, because the emotional and social items correlate only weakly with each other. Whether a scale is unidimensional is a question for factor analysis (Section 4).
A Common Claim: What an Alpha of 0.904 Shows
The seven depression items of the course dataset have an alpha of 0.904, and a report of that analysis might state: "An α of 0.904 indicates that the seven depression items measure essentially the same construct." Alpha shows how strongly the items correlate on average, which a set of items measuring two constructs can also do. The evidence that the depression items measure one construct comes from a parallel analysis of those items, which kept one factor, and from a one-factor solution, in which every loading was 0.69 or higher.
Question. Rewrite the quoted sentence so that it claims only what alpha shows.
Above about 0.95, a high alpha usually means that items repeat each other, for example "I feel lonely" and "I feel alone". Redundant items lengthen the questionnaire and burden respondents, and they can narrow the construct to whatever the repeated items share. A good scale covers the breadth of its construct, which keeps the item correlations moderate.
Alpha assumes a reflective model in which one construct causes all of the answers. The components of a formative index are not expected to correlate, so a low alpha for an index is expected and says nothing about its quality. Activity 7.2 shows that the components of the Steptoe social isolation index in the CSCS correlate between −0.10 and 0.36 and give an alpha of 0.34, a value that should not be reported as a measure of the index's reliability.
Reliability concerns random error, and validity concerns whether the score measures the intended construct. A bathroom scale that always reads two kilograms too heavy is perfectly consistent and systematically wrong. A loneliness scale could be highly reliable and still mainly measure general distress. Reliability limits validity, because a score that is mostly error cannot correlate strongly with anything, but it does not establish it. Section 3 takes up validity.
If positively and negatively worded items are summed as stored, half of the items count in the wrong direction. Activity 7.2 shows that the six-item alpha falls from 0.59 to 0.42 when the three social items are left unreversed. The total score would be distorted in the same way, and every association estimated with it would be biased toward zero.
In addition to these limits, alpha rests on an assumption that is easy to overlook: that every item measures the construct equally well, a condition called tau-equivalence. By this we mean that each item is assumed to be just as strongly tied to the construct as every other item, so that no item is a better or worse indicator than the rest. Formally, each item is assumed to have the same loading on the common factor, a term that Section 4 explains in full. Real scales rarely meet this assumption exactly. When some items are stronger indicators than others, alpha treats them all as if they were average, and as a result it underestimates the reliability of the total score. For example, the assumption is plausible for the social items, whose loadings are similar, so alpha should be close to the true reliability of the social subscale. It is clearly false for the emotional items, where one item is much weaker than the other two, so alpha is likely to understate the reliability of the emotional subscale.
When the items differ in quality, a reliability coefficient that allows each item its own loading gives a better estimate of the reliability of the total score. The next subsection introduces such a coefficient, McDonald's omega.
4.3 McDonald's Omega and What to Do About a Weak Item
McDonald's omega (McDonald, 1999) estimates the reliability of a sum score from a factor model, which allows each item to have its own loading. This is the key difference from alpha. Instead of assuming that every item is an equally good indicator, omega first estimates how strongly each item is tied to the construct and then uses those separate estimates to judge the total score. For a scale with a single factor, omega is the share of the variance of the total score that is explained by the factor. By this we mean that omega splits the differences between people's total scores into a part that comes from the construct the items share and a part that comes from each item's unique variance, and reports the first part as a proportion. This matches the classical definition of reliability in Section 1, with the factor playing the role of the true score. Equation 7.7 gives omega for a one-factor model.
sum(lambda)^2 / (sum(lambda)^2 + sum(f_soc$uniquenesses)), which prints 0.754 for the social items.When the loadings are equal, omega equals alpha, and when they differ, omega is the better estimate. Activity 7.2 computes omega for both subscales from a one-factor model fitted with fa(), which Section 4 explains in detail. The social loadings are similar (0.73, 0.73 and 0.67), and alpha and omega are both 0.75. The emotional loadings are very unequal (0.83, 0.20 and 0.58), so omega (0.57) is higher than alpha (0.51). Both values are low. When omega is noticeably above alpha, one item usually has a much weaker loading than the others. Omega is now recommended alongside or in place of alpha in many fields, and reporting both lets readers compare a study with earlier work that reported only alpha.
The weak item still has to be dealt with. The case card below shows how Amira decides what to do about miss, and the same reasoning applies to a weak item in any published scale.
The alpha output shows that the emotional item "I miss having people around me" has a corrected item-total correlation of 0.16, and that alpha for the emotional subscale would rise from 0.51 to 0.64 if it were dropped. It is tempting to delete the item and report the higher value. Amira decides against making that her main analysis, for three reasons. The published scoring rule uses all three items, so a two-item subscale would not be comparable with other studies of the scale. An alpha chosen after looking at the data overstates reliability in new samples. The item also covers a part of emotional loneliness (missing the presence of others) that the other two items do not. Her reply therefore keeps the published subscale as the main measure, reports alpha and omega for it, names the weak item, and adds a sensitivity analysis that repeats her main model with the two-item version. If the conclusions agree, the weak item has not driven them.
Keeping the published subscale as the main measure, reporting alpha and omega, naming the weak item and testing it with a sensitivity analysis protects both the comparability of the results and the honesty of the reliability estimate. The card below links to a narrated R walkthrough of the same reliability analysis, which you may find useful before running the activity.
Narrated R walkthrough: Factor Analysis and Scale Scoring
The Factor Analysis and Scale Scoring walkthrough runs the same reliability analysis line by line with narration, from recoding the items to the effect of a missed reversal. It is a useful companion to Activity 7.2 for anyone who would like to see each step demonstrated before running it.
Open the Factor Analysis and Scale Scoring walkthroughActivity 7.2 brings the section together in R. It computes alpha and the item statistics for both subscales, omega from one-factor models, the correlations and alpha of the Steptoe index, and the six-item alpha with and without the reversal. Run the script alongside the activity and answer its questions from your own output.
Text version of the activity: the code of the run-along script, its console output and notes on reading it.
github_url <- "https://raw.githubusercontent.com/jorgeandr3s/heal/main/cscs/public_data/CSCS2025_full_cleaned_deidentified_data_and_metadata.RData"
load(url(github_url))                      # survey data, read from the web
data <- data[data$SURVEY_collection_year == 2021, ]   # the 2021 wave
dj <- data[, paste0("LONELY_dejong_emotional_social_loneliness_scale_",
                    c("emptiness", "miss", "rejected", "rely", "trust", "close"))]
names(dj) <- c("emptiness", "miss", "rejected", "rely", "trust", "close")
answers <- c("No", "More or less", "Yes")  # coded 1, 2 and 3; anything else NA
stored <- na.omit(data.frame(lapply(dj, match, table = answers)))
soc <- c("rely", "trust", "close")         # the positively worded items
items <- stored
items[, soc] <- 4 - stored[, soc]          # reverse: 1 becomes 3, 3 becomes 1
nrow(items) # people who answered all six itemsThe file is read straight from the web, and the 2021 wave gives one row per person. match() turns each text answer into its position in answers (No = 1, More or less = 2, Yes = 3), so any other answer, such as "Presented but no response", becomes NA, and na.omit() keeps the 3,415 people who answered all six items. stored holds the codes as answered; items reverses the three positively worded social items, so a higher code means a lonelier answer on every item. Alpha and omega are therefore computed from the three-point item codes (1 to 3), whereas the published subscale and total scores use the 0 or 1 rule of Section 1.
library(psych)                             # alpha() and fa()
social_items    <- items[, soc]
emotional_items <- items[, c("emptiness", "miss", "rejected")]
alpha(social_items)
a_emo <- alpha(emotional_items)
round(a_emo$total, 2)                      # overall alpha only
round(a_emo$alpha.drop[, 1:2], 2)          # alpha if each item is dropped
round(a_emo$item.stats[, "r.drop", drop = FALSE], 2) # corrected item-total rReading the output. The first row gives raw_alpha 0.75 (computed from the item codes) and std.alpha 0.75 (computed from the correlations), with an average_r of 0.5. The Feldt 95% confidence interval runs from 0.74 to 0.77. Under Reliability if an item is dropped, removing any one social item lowers alpha to 0.66 to 0.69, so every item contributes. Under Item statistics, r.drop is the corrected item-total correlation, the correlation of each item with the sum of the other two: 0.60, 0.59 and 0.56. The last table shows how often each answer was given. The $total, $alpha.drop and $item.stats parts of the result can be printed separately: for the emotional subscale, raw alpha is 0.51 with an average inter-item correlation of 0.25, dropping miss would raise alpha to 0.64 whereas dropping either other item would lower it to about 0.2 to 0.3, and the corrected item-total correlation for miss is 0.16, against 0.43 and 0.40 for the other two items.
f_soc  <- fa(social_items, nfactors = 1)   # one-factor model
lambda <- f_soc$loadings[, 1]              # the three loadings
round(lambda, 2)
sum(lambda)^2 / (sum(lambda)^2 + sum(f_soc$uniquenesses))   # omega
f_emo  <- fa(emotional_items, nfactors = 1)
lambda <- f_emo$loadings[, 1]
round(lambda, 2)
sum(lambda)^2 / (sum(lambda)^2 + sum(f_emo$uniquenesses))fa(..., nfactors = 1) fits a one-factor model and returns the loadings and the unique variances ($uniquenesses). The last line of each block applies the omega formula (Equation 7.7). For the social items, omega is 0.754, the same as alpha, because the three loadings are similar. For the emotional items, omega is 0.568, higher than the alpha of 0.51, because the loading of miss (0.20) is far below the others. The omega() function in psych gives the same values.
iso <- data[, paste0("LONELY_steptoe_isolation_index_",
                     c("unmarried", "clubs", "friends", "kids", "other_fam"), "_num")]
names(iso) <- c("unmarried", "clubs", "friends", "children", "family")
iso <- na.omit(iso)
round(cor(iso), 2)
round(alpha(iso)$total[, 1:2], 2) # shown only to explain why it is not reportedThe five components of the Steptoe social isolation index correlate only weakly (from −0.10 to 0.36), and alpha is 0.34 for the 3,430 people with all five components. For a formative index this is expected: being unmarried does not make a person more likely to have little contact with friends. The value is printed here only to show why it should not be reported as the reliability of an index.
round(alpha(items)$total[, 1:2], 2)With the social items correctly reversed, alpha for all six items is 0.59, lower than the 0.75 of the social items alone. psych prints a note and then a warning that miss is negatively correlated with the first principal component: miss is correctly coded but relates weakly, and slightly negatively, to the social items. The suggested option check.keys = TRUE would flip flagged items automatically, which here would reverse a correctly coded item. Which items to reverse is decided by the scoring manual, and the warning is a prompt to check the coding. Question 3 asks you to run alpha(stored), the six items as answered, before the reversal.
R Reflect on what you just ran
Answer each question from your own output, as on the final exam: find the number, say what it means, judge the check.
1. Report alpha for the social and the emotional subscale, with the 95% confidence interval where it is printed. Is the reliability of each subscale adequate for comparing groups of participants in research? Would either be adequate for deciding which individual participants are offered a loneliness support programme? Explain.
2. Describe how the item miss ("I miss having people around me") behaves, using the alpha() output, and explain why omega is higher than alpha for the emotional subscale but equal to alpha for the social subscale. A colleague proposes reporting the two-item emotional subscale (alpha 0.64) as the main measure. What should be done instead, and why?
miss is weak: its corrected item-total correlation (r.drop) is only 0.16, against 0.43 and 0.40 for the other two items, and alpha would rise from 0.51 to 0.64 without it, whereas dropping either other item would lower alpha (to 0.21 or 0.28). Alpha assumes that every item has the same loading (tau-equivalence); the social loadings are similar (0.73, 0.73 and 0.67), so alpha and omega are both 0.75, but the emotional loadings are very unequal (0.83, 0.20 and 0.58), so alpha (0.51) underestimates reliability and omega (0.57) is the better estimate. Keep the published three-item subscale as the main measure, report alpha and omega, name miss as a weak item, and run a sensitivity analysis with the two stronger items; if the conclusions agree, miss has not driven them. The published scoring rule uses all three items, so a two-item score would not be comparable with other studies, and an alpha chosen after looking at the data overstates reliability in new samples.3. Run your own code: at the end of the script, type alpha(stored) and run it. The data frame stored holds the six items as they were answered, before rely, trust and close were reversed. Which items does psych flag, what do their r.drop and alpha-if-dropped values suggest, and why has this happened? A colleague suggests rerunning alpha() with check.keys = TRUE, or dropping the flagged items: what should be done instead, and why? Finally, after the correct reversal, alpha for the six items is 0.59: does this show that the six items measure a single construct?
emptiness and rejected: their corrected item-total correlations (r.drop) are close to zero (0.046 and 0.064), and alpha would rise to 0.47 and 0.46 without them, so they appear to move against the rest of the items. This has happened because rely, trust and close are positively worded and have not been reverse-coded as the scoring manual requires, so three items count in one direction and three in the other; psych cannot tell which half is wrong, and it flags the items that run against the three strongly correlated social items. Reverse rely, trust and close as the scoring manual says and recompute alpha, rather than rerunning with check.keys = TRUE or dropping items: check.keys = TRUE would reverse emptiness and rejected (the wrong items), and in the correctly coded data it would reverse miss, a correctly coded item that is simply weak, while dropping items would remove good items to hide a coding error. No: alpha shows how strongly the items hang together on average and rises with the number of items, so it cannot show that the items measure a single construct; here the six-item alpha (0.59) is even lower than that of the three social items alone (0.75), and whether one or two constructs underlie the items is a question for factor analysis, since the scale was designed with two subscales.Your output from Activity 7.2 contains every value interpreted in this section, from the alpha of 0.34 for an index to the weak loading of miss and the effect of a missed reversal.
This section has shown that internal consistency applies only to scales, that a missed reversal is fixed from the scoring manual, that a single survey supports only internal consistency, that the social subscale of the De Jong Gierveld scale has adequate internal consistency (alpha and omega of 0.75), and that the emotional subscale has low internal consistency (alpha of 0.51 and omega of 0.57). It has also shown that alpha must be read with its assumptions in mind. A reliable score can still measure the wrong construct, so Section 3 turns to validity. The key takeaways below draw the section together before its knowledge check.
Key Takeaways
- 1.3 Alpha assumes a reflective model, in which one construct causes all of the answers, so it only makes sense for a scale. The components of a formative index define the construct and are not expected to correlate, so a low alpha for an index is expected and says nothing about its quality: the five components of the Steptoe social isolation index correlate between −0.10 and 0.36 and give an alpha of 0.34, which is not reported as its reliability. When a question shows a low alpha for a measure built by adding yes or no components, such as being unmarried or belonging to no club, first decide whether it is an index, and if it is, say that alpha does not apply rather than calling the measure unreliable. An index is judged instead by whether its components cover the definition of the construct and whether it relates to other variables as theory predicts.
- 2.3 A missed reversal leaves clear fingerprints in
alpha()output, and learning to spot them protects you from one of the most common errors in survey analysis. Look for three signs together: psych's warning that some items "probably should be reversed", a negativer.dropfor an item worded in the opposite direction to the others (people who score high on the rest of the scale score low on it), and an alpha lower than it should be (0.42 instead of 0.59 when the three social items were left unreversed). The fix is to check the scoring manual, reverse-code the item if the manual says so and recompute alpha, not to drop the item. Do not letcheck.keys = TRUEmake the decision for you, because it flips whatever is flagged, and in Activity 7.2 it would have reversedmiss, a correctly coded item that is simply weak. The scoring manual, notcheck.keys = TRUE, decides which items are reversed, and a low positiver.droppoints to a weak item rather than a coding error. - 3.2 Reliability always means consistency, so the first question to ask is "consistent across what?" Test-retest reliability asks whether the same people get similar scores on two occasions a short interval apart, inter-rater reliability asks whether two observers who rate the same people agree, and internal consistency asks whether the items of one scale move together on a single occasion. Each kind needs its own design: two administrations of the measure, two or more raters, or one administration of a multi-item scale. When a question describes a study, read its design before you name a statistic. A single cross-sectional survey such as the CSCS, asked once and with no raters, supports only internal consistency, so evidence on stability over time has to come from the scale's published studies and should be cited as such.
- 3.3 For test-retest reliability of a score, the intraclass correlation (ICC) asks whether people receive the same score twice, not just whether they keep the same rank order. That is why a shift in everyone's scores between occasions lowers the ICC even when the Pearson correlation is unchanged: in Worked Example 7.1, adding 4 points to every second score leaves the Pearson correlation at 0.97 but lowers the ICC from 0.98 to 0.71. Describe an ICC with Koo and Li's bands (below 0.50 poor, 0.50 to 0.75 moderate, 0.75 to 0.90 good, above 0.90 excellent), and if a question reports a mean change between occasions, say that the ICC counts the shift as disagreement and check the timing, because test-retest reliability assumes the construct itself did not change. For two raters classifying people into categories, Cohen's kappa removes the agreement expected by chance, so 0 means agreement no better than chance and 1 means perfect agreement. Kappa is therefore lower than the raw percentage agreement, and much lower when one category is rare, because chance agreement on the common category is then high: in the second kappa example of 3.3, 92% agreement gives a kappa of only 0.29 when each interviewer calls just 6% of people lonely.
- 4.1 When you run
alpha()from the psych package, three parts of the output carry most of the information. The first line givesraw_alpha, with its 95% confidence interval below it; the "Reliability if an item is dropped" table shows what alpha would become without each item; and ther.dropcolumn of the item statistics is the corrected item-total correlation, the correlation of each item with the sum of the other items. Read them together: an item with a lowr.drop(below about 0.3) whose removal would raise alpha is a weak item, asmissis in the emotional subscale (0.16, with alpha rising from 0.51 to 0.64 without it), and the response frequencies at the bottom of the output can show why, for example a floor effect when most people give the same lowest answer. To judge whether a value is adequate, always tie it to the use: about 0.70 suffices in the early stages of research, about 0.80 is adequate for basic research comparing groups, and 0.90 or higher is needed for decisions about individuals, such as classifying a person with a clinical cut-point. A strong exam answer gives the value, the guide and the use in one sentence, for example "an alpha of 0.79 is adequate for comparing groups but too low for decisions about individual members". - 4.2 Alpha is easy to compute and easy to over-read, so it helps to know exactly what it can and cannot tell you. Cronbach's alpha rises with the number of items, assumes equal loadings and cannot show unidimensionality, so McDonald's omega is reported alongside it. Because alpha depends on the number of items as well as on their average correlation, a long scale built from two related clusters of items can still reach 0.80 or more, so a high alpha never answers the question "one construct or two?"; that question belongs to factor analysis. Higher is not always better either, because values above about 0.95 usually mean that some items are near copies of each other. A common exam trap pairs a high alpha with a parallel analysis that suggests two factors: the two findings do not contradict each other, because alpha shows how strongly the items hang together on average, not how many things they measure.
- 4.3 McDonald's omega is calculated from a one-factor model, so each item can have its own loading instead of the equal loadings that alpha assumes (tau-equivalence). When the loadings are similar, omega and alpha agree, as they do for the social subscale (both 0.75); when the loadings differ, alpha underestimates reliability and omega is the better estimate, as for the emotional subscale (loadings 0.83, 0.20 and 0.58; alpha 0.51 and omega 0.57). If a question shows omega noticeably above alpha, look for one item whose loading is much weaker than the others. When a published scale has a weak item, resist the urge to delete it just because alpha would rise: keep the published scale as the main measure so that your results remain comparable with other studies, report alpha and omega, name the weak item, and run a sensitivity analysis without it, because an alpha chosen after looking at the data overstates reliability in new samples. If the conclusions agree, the weak item has not driven them.
1. Fifty patients with a stable chronic illness complete a fatigue questionnaire (scored 0 to 40) twice, two weeks apart. The Pearson correlation between the two occasions is 0.86, the intraclass correlation for absolute agreement is 0.68, and the mean score is 3 points higher on the second occasion. Which statement is correct?
2. A six-item health anxiety scale is answered from 1 to 5. Item H4, "I rarely worry about my health", is worded in the opposite direction to the other five items, and the scoring manual says that it must be reverse-coded. An analyst runs alpha() on the items as stored and gets the output below. A colleague proposes dropping H4, because alpha would rise from 0.43 to 0.74 without it. What should be done?
Some items ( H4 ) were negatively
correlated with the first principal
component and probably should be
reversed.

 raw_alpha
      0.43

 Reliability if an item is dropped:
   raw_alpha
H1      0.22
H2      0.23
H3      0.24
H4      0.74
H5      0.25
H6      0.26

 Item statistics
   r.drop
H1   0.45
H2   0.43
H3   0.42
H4  -0.56
H5   0.41
H6   0.39
r.drop, the correlation of the item with the sum of the other items. A negative r.drop means that people who score high on the other items score low on H4, which is what an oppositely worded item does when it has not been reversed, and psych's warning points the same way. The remedy is the manual's: recode H4 as (5 + 1) − code and recompute alpha; in data like these alpha then rises to about 0.78, above the 0.74 from dropping the item, and the published scale stays intact. Option a treats a coding error as a bad item, and option b lets the software decide which items to reverse, which can flip a correctly coded item. (Section 2, 2.3 Spotting a Missed Reversal: The Scoring Manual Decides, and Activity 7.2; Objective 2.3)3. A 20-item scale has an alpha of 0.88 in a survey of 2,000 adults, and the average correlation between pairs of items is 0.27. Which conclusion is justified?
4. A published three-item emotional support subscale is analyzed in a new sample. Alpha is 0.58 and McDonald's omega is 0.63. The one-factor loadings are 0.80, 0.25 and 0.70. Item S2 has an r.drop of 0.21, against 0.50 and 0.47 for the other two items, and alpha would rise to 0.72 if S2 were dropped. Which plan is best?
r.drop, which marks a weak item rather than an unreversed one (that would be negative), so option d is wrong. Option a is tempting, but dropping a published item after looking at the data makes the scores incomparable with other studies and overstates reliability in new samples, so the item is kept, reported and tested with a sensitivity analysis; and because both values are below 0.70, the subscale is described as having low internal consistency (option b). (Section 2, 4.3 McDonald's Omega and What to Do About a Weak Item, Equation 7.7 and the running case card; Objectives 4.3 and 4.1)5. An analyst computes alpha = 0.34 for the five components of the Steptoe social isolation index in the CSCS (being unmarried and not living with a partner; less than monthly contact with children, with other family and with friends; and taking part in no groups) and writes that "the index is unreliable and should be replaced." Which response is best?
6. A health region's online survey asks a five-item vaccine confidence scale (scored 5 to 25) once. In a sub-study, 45 parents answer the scale again three weeks later, and a local measles outbreak is reported between the two occasions. The intraclass correlation for absolute agreement is 0.71, the Pearson correlation is 0.84, and the mean score rises from 17.6 to 19.0. Which statement is correct?
Validity
Scores fall as the number of close friends rises
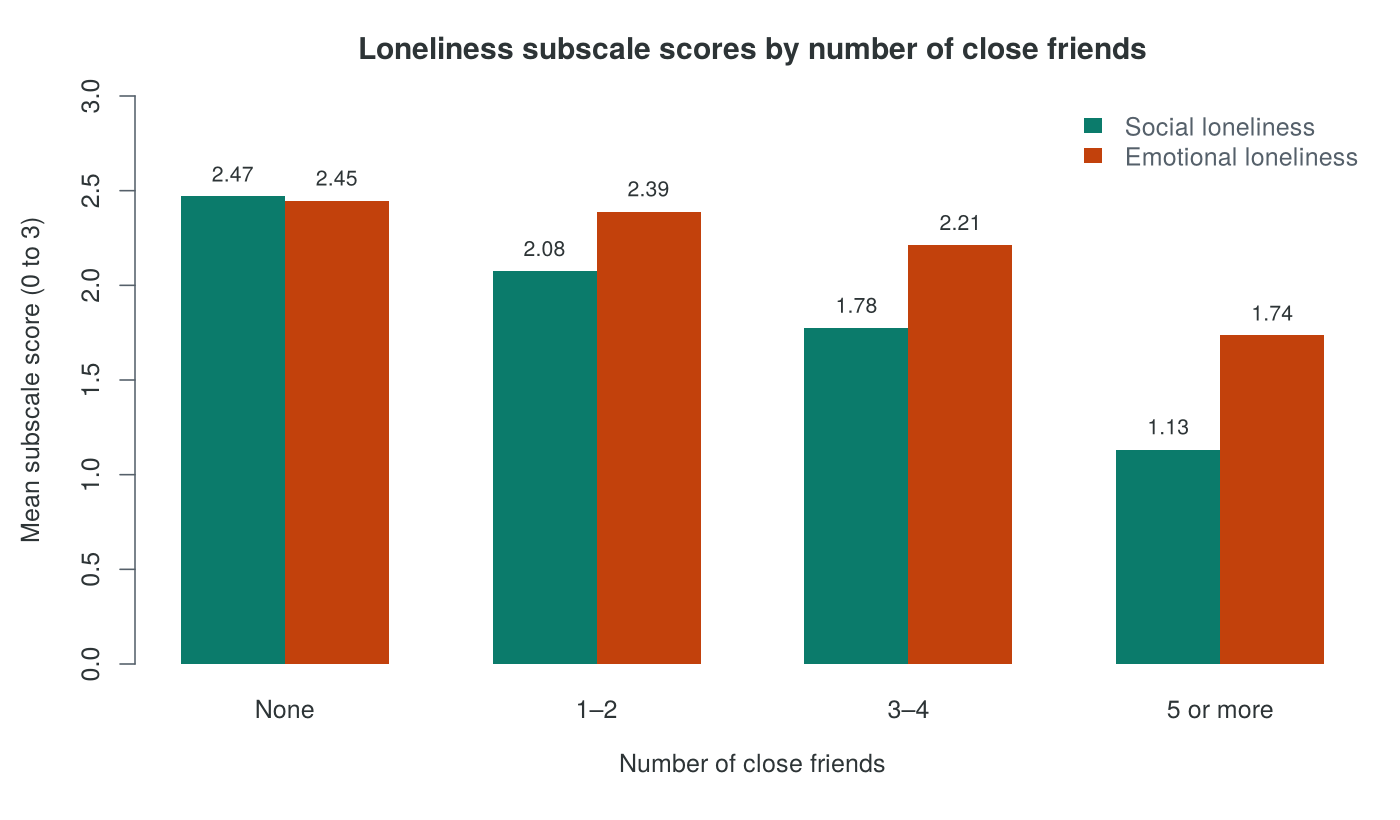
Overview
A reliable score is consistent, and consistency does not show that the score measures the intended construct. Validity concerns the meaning of scores: whether a loneliness score reflects loneliness or instead reflects low mood, social desirability or something else that the items happen to share. Texts written for readers appraising a study often use construct validity for the broad question of whether an instrument captures its construct, which this lesson calls validity. This lesson reserves construct validity for evidence that scores relate to other measures as theory predicts (convergent, discriminant and known-groups evidence), and the COSMIN taxonomy groups structural and cross-cultural validity under construct validity. This section takes the analyst's perspective. It separates validity from reliability, classifies the kinds of validity evidence, frames validity as an argument for a particular use of scores in a particular population, organizes the evidence with the COSMIN taxonomy, explains how to judge whether a change in scores is important, gathers construct validity evidence for the De Jong Gierveld scale from the CSCS data, and explains why comparisons between groups depend on measurement invariance.
Learning Objectives
- 5.1 Distinguish reliability from validity, and explain why a reliable measure is not necessarily valid.
- 5.2 Classify validity evidence as content and face validity, criterion validity (concurrent and predictive), construct validity (convergent, discriminant and known groups) or structural validity.
- 5.3 Explain validity as an argument assembled from several kinds of evidence for a particular use in a particular population, and why a scale should not simply be called "validated".
- 5.4 Use the COSMIN taxonomy to organize the measurement properties of an instrument.
- 5.5 Define the minimal important difference, compare anchor-based and distribution-based estimates of it, and judge whether a given difference is important.
- 5.6 Interpret convergent, discriminant and known-groups evidence computed in R.
- 5.7 Explain why a comparison of mean scores between groups depends on measurement invariance.
5.1 Reliability and Validity
Reliability concerns random error, the scatter of scores around a person's true score. Validity concerns systematic error, whether the true score itself corresponds to the intended construct. The two are linked in one direction only. A score that is mostly random error cannot correlate strongly with anything, so low reliability limits validity. A highly reliable score can still measure the wrong construct, as a bathroom scale that always reads two kilograms heavy is consistent and wrong, and a loneliness scale could be highly reliable and still mainly measure general distress. Reliability is therefore necessary for validity but never enough to establish it, and a high alpha is never by itself evidence that a measure is valid.
Figure 7.4 illustrates the relation with three dartboards, in which the spread of the darts stands for reliability and their position relative to the bullseye stands for validity.
A consistent score can therefore still miss its target, and validity has to be supported by evidence of its own. The next subsection describes the kinds of evidence from which that support is built.
5.2 Kinds of Validity Evidence
Validity evidence is usually grouped into four families, each of which supports a different claim about the scores. Content evidence (with face validity as its weakest form) asks whether the items cover the construct. Criterion evidence asks whether scores agree with a gold standard measured at the same time (concurrent) or later (predictive). Construct evidence asks whether scores relate to other variables as theory predicts, through convergent, discriminant and known-groups comparisons. Structural evidence asks whether the items form the domains the theory describes.
The six cards below define each kind of evidence and give an example from the loneliness scale or from screening. Click each card, and note in particular how convergent and discriminant evidence are judged together and which kind of evidence the reviewer's first question calls for.
Criterion validity is the most direct evidence when a trusted gold standard exists, as it does for many diagnostic tests. For psychological constructs such as loneliness there is no gold standard, so the argument relies mainly on content, construct and structural evidence (Cronbach & Meehl, 1955). Construct validity is tested by writing down, before looking at the data, the correlations and group differences that theory predicts, and then checking them. COSMIN calls this hypothesis testing. Stating the hypotheses in advance guards against reading support into whatever pattern appears.
When a score is used with a cut-point to classify people, criterion validity evidence is summarized by comparing the classification with the gold standard. The sensitivity is the share of people who have the condition according to the gold standard whom the cut-point flags, and the specificity is the share of people without the condition whom it correctly does not flag. For example, a sensitivity of 0.70 and a specificity of 0.90 mean that the cut-point finds about 7 in 10 people with the condition and misses about 3 in 10, while it wrongly flags about 1 in 10 people without the condition.
Each kind of evidence supports one claim about the scores. The next subsection describes how current measurement theory combines them into a single judgement.
5.3 Validity as an Argument
Early textbooks listed "types of validity" as if a scale either had or lacked each one. Current measurement theory treats validity as a single, overall judgement about how well the evidence supports a particular interpretation and use of scores (Messick, 1989, 1995; AERA, APA & NCME, 2014). By this we mean that validity belongs to the way scores are interpreted and used, not to the questionnaire itself. The same loneliness scale might be well supported for comparing average loneliness between groups in a survey and poorly supported for deciding which individual patients should be referred to a program, because these are different uses that make different claims about what the scores mean. The different kinds of evidence in 5.2 are therefore not separate validities that a scale collects; they are pieces of support for one interpretation. Kane (2013) describes how these pieces are put together, calling validation the construction of an argument in two steps. The first step states the interpretation and use: for example, "scores on the De Jong Gierveld scale rank adults in an online Canadian survey by their degree of loneliness, and differences in mean scores between groups reflect differences in loneliness". The second step gathers evidence for each claim that this interpretation depends on, including that the items cover loneliness, that the answers form the intended domains, that the scores relate to other variables as expected, and that the items work the same way in the groups being compared.
Two consequences follow. Support for a scale is always relative to a stated use in a stated population, so a scale should not simply be called "valid" or "validated" in general. Evidence that the De Jong Gierveld scale works well in the populations in which it was developed supports, without settling, its use with Canadian adults of all ages in an online survey, and evidence gathered for comparing groups in research does not transfer automatically to decisions about individuals. Validation is also cumulative: each study that uses a scale and reports how its scores behave adds to the argument. A Measures paragraph therefore states what the evidence supports, for which use and in which population, and what is missing.
An argument assembled from many kinds of evidence needs a way to organize them, and the next subsection presents the taxonomy most often used for that purpose.
5.4 The COSMIN Taxonomy
The COSMIN initiative (Consensus-based Standards for the selection of health Measurement Instruments) developed, through an international Delphi study, a taxonomy and definitions for the measurement properties of health instruments (Mokkink et al., 2010). It groups the properties into three domains: reliability, validity and responsiveness. It is widely used in systematic reviews of measurement instruments, and it is a useful checklist for the Measures paragraph of a manuscript.
Table 7.2 lists the three COSMIN domains with their measurement properties, the question that each property answers, and the evidence for the De Jong Gierveld scale that this lesson provides. Read the last column as a checklist: it shows which properties the CSCS data can assess and which must come from published studies or a different design.
Table 7.2. The COSMIN domains and measurement properties, with the evidence for the De Jong Gierveld scale in this lesson.
| Domain | Measurement property | Question it answers | Evidence for the De Jong Gierveld scale in this lesson |
|---|---|---|---|
| Reliability | Internal consistency | Do the items of each domain move together? | Alpha and omega in the CSCS sample (Section 2) |
| Reliability | Are scores stable over occasions or raters? | Published studies only; not estimable from one CSCS wave | |
| Measurement error | How large is the error in a person's score? | Not assessed in this lesson | |
| Validity | Content validity (including face validity) | Do the items cover the construct? | Item wording based on Weiss's two domains (Section 1) |
| Construct validity: structural validity, hypothesis testing, cross-cultural validity | Do the items form the predicted domains, and do scores relate to other variables as predicted? | Factor analysis (Section 4); correlations and known groups (this section) | |
| Criterion validity | Do scores agree with a gold standard? | No gold standard for loneliness | |
| Responsiveness | Responsiveness | Do scores change when the construct changes? | Needs longitudinal data |
COSMIN also describes interpretability (for example, what size of difference in scores is meaningful) as an important characteristic of an instrument, alongside the three domains.
Table 7.2 shows that, beyond internal consistency, the CSCS data can add two kinds of validity evidence for the De Jong Gierveld scale: hypothesis testing through correlations and known groups, which 5.6 computes, and structural validity through factor analysis, which Section 4 tests. Before turning to those, the next subsection takes up the property that sits beside the three domains, interpretability.
5.5 The Minimal Important Difference
Responsiveness asks whether scores change when the construct changes, and interpretability asks what a change of a given size means. Statistical significance shows whether a difference is likely to be real, not whether it matters. The minimal important difference (MID) is the smallest change in scores that people would regard as important, or that would justify a change in care (Jaeschke, Singer & Guyatt, 1989). It is estimated in two ways. An anchor-based estimate links score changes to an external judgement, the anchor: for example, participants report at follow-up whether their loneliness is "a little better", and the MID is the mean change in score among those who chose that answer. A distribution-based estimate uses only the spread and the reliability of the scores. Two common versions are half a standard deviation of the baseline scores (Norman, Sloan & Wyrwich, 2003) and one standard error of measurement (Wyrwich, Tierney & Wolinsky, 1999). Equation 7.8 defines the standard error of measurement.
The two approaches answer different questions. Distribution-based values describe how large a change is compared with the spread of scores and the error in them. The SEM, for example, tells us how far a person's observed score typically sits from their true score, so a change smaller than one SEM could easily be produced by measurement error alone. However, these values say nothing directly about whether people would notice or value the change, because no one has been asked. Anchor-based estimates, by contrast, tie the change to people's own judgement of whether they are better. For this reason anchor-based estimates are preferred when they exist, and distribution-based values serve as a check. As an illustration, consider a loneliness scale scored 0 to 6 whose baseline scores have a standard deviation of 1.6 and a reliability of 0.75 (hypothetical values). In R, half the standard deviation (1.6 / 2) and the SEM (1.6 * sqrt(1 - 0.75)) both return 0.8 points; the two coincide whenever the reliability is 0.75. If participants who reported feeling "a little better" improved by 1.0 point on average, the anchor-based MID would be 1.0. A program that lowers the mean score by 0.4 points then produces a change below every estimate of the MID, even if a large trial finds it statistically significant.
A difference is therefore judged against every estimate of the MID that is available, with the anchor-based value carrying most weight. The next subsection returns to the CSCS and gathers the construct validity evidence that Table 7.2 lists for the De Jong Gierveld scale.
5.6 Construct Validity Evidence from the CSCS
Before computing anything, Amira writes down what the theory of the scale predicts. Loneliness is usually defined as the distress that follows from a gap between the relationships a person has and those they want (Perlman & Peplau, 1981), and Weiss (1973) distinguished its emotional and social forms. The total score should therefore correlate positively with another loneliness measure, the three-item UCLA Loneliness Scale (Hughes et al., 2004), and negatively with perceived social support, measured in the CSCS with the Multidimensional Scale of Perceived Social Support (Zimet et al., 1988). It should correlate less strongly with anxiety symptoms (measured with the two-item GAD-2), a related but distinct construct. The social subscale, which concerns the wider network, should relate more strongly to social support and to the number of close friends than the emotional subscale does.
Activity 7.3, at the end of this section, tests these predictions with a correlation matrix for the convergent and discriminant hypotheses and a comparison of subscale means by number of close friends for the known-groups hypothesis. The results support most of the predictions. The total score correlates 0.45 with the UCLA scale and −0.49 with perceived social support (convergent evidence; the sign is negative because more support goes with less loneliness), and only 0.33 with anxiety (discriminant evidence), so the convergent correlations exceed the discriminant one in absolute size. The gap is modest, which is common for constructs that share an emotional component, and a discriminant correlation needs only to be clearly lower than the convergent ones, not zero. The two subscales show the distinct patterns the theory predicts: the social subscale relates most strongly to social support (−0.48, compared with −0.26 for the emotional subscale), whereas the emotional subscale relates more strongly to the UCLA scale and to anxiety. The two subscales correlate only 0.21 with each other.
Figure 7.5 plots the known-groups comparison for the two subscales. Both fall steadily as the number of close friends rises, and the gradient is much steeper for social loneliness (2.47 to 1.13) than for emotional loneliness (2.45 to 1.74), as Weiss's distinction predicts.
These results are encouraging, but two features of the data limit how far they can be pushed, as the caution below explains.
Interpreting Validity Correlations with Care
Validity correlations are themselves attenuated by unreliability (Section 1). The emotional subscale has an alpha of 0.51, so its correlations with other measures are weakened, and part of the difference between the subscales' correlations could reflect their different reliabilities. The CSCS is also a cross-sectional online survey that recruited volunteers, so these correlations describe this sample and support, without proving, the same pattern in other populations.
Figure 7.5 compares mean scores between groups, and any such comparison rests on an assumption that the next subsection examines.
5.7 Measurement Invariance
A comparison of mean scores between groups, such as older and younger adults, assumes that the items relate to the construct in the same way in each group. If younger adults interpret "I miss having people around me" differently from older adults, a difference in mean scores could arise from the item's wording rather than from a real difference in loneliness. The same concern applies to a scale answered in two languages, where a translated item may be understood differently; COSMIN places this cross-cultural validity under construct validity (Table 7.2). Measurement invariance is the property that the items measure the construct in the same way in every group being compared. By this we mean that two people in different groups who have the same true level of loneliness should be expected to give the same answers to each item, so that any difference in mean scores between the groups reflects a difference in loneliness and not a difference in how the items are understood. Measurement invariance testing checks this assumption by fitting the confirmatory factor model of Section 4 in each group and testing whether the loadings and item intercepts are equal. Equal loadings mean that each item is tied to the construct equally strongly in every group. Equal intercepts mean that, at the same level of the construct, people in each group tend to give the same answer to the item, which is what a comparison of means requires. A full treatment is beyond this lesson. In a manuscript that compares groups, it is good practice to state that the comparison assumes invariance, to cite any published invariance evidence and to note comparisons for which it is missing.
Activity 7.3 gathers the construct validity evidence of 5.6 in R and ends with a question on what must be true of the scale before mean scores are compared between groups. Run the script alongside the activity and answer its questions from your own output.
Text version of the activity: the code of the run-along script, its console output and notes on reading it.
load(url("https://raw.githubusercontent.com/jorgeandr3s/heal/main/cscs/public_data/CSCS2025_full_cleaned_deidentified_data_and_metadata.RData"))   # CSCS data, read from the web
data <- data[data$SURVEY_collection_year == 2021, ]   # one row per person
nrow(data)The file is read straight from the web (an internet connection is needed). Keeping the 2021 wave leaves 4,045 people, one row per person.
social    <- data$LONELY_dejong_social_loneliness_sub_scale_score      # 0 to 3
emotional <- data$LONELY_dejong_emotional_loneliness_sub_scale_score   # 0 to 3
val <- data.frame(total     = data$LONELY_dejong_emotional_social_loneliness_scale_score,
                  social    = social,
                  emotional = emotional,
                  ucla      = data$LONELY_ucla_loneliness_scale_score,
                  support   = data$PSYCH_zimet_multidimensional_social_support_scale_score,
                  anxiety   = data$WELLNESS_gad_score)
val <- na.omit(val)          # people with every score
nrow(val)The De Jong Gierveld subscale scores (0 to 3) and total score (0 to 6) supplied with the CSCS file are the same, person by person, as the scores built with the published rule in Section 1. The other measures were scored by the CSCS team and are used as supplied: the three-item UCLA Loneliness Scale (3 to 9), the Multidimensional Scale of Perceived Social Support (an average from 1 to 7) and the two-item GAD-2 anxiety screener (0 to 6). The 3,053 people in val have every score.
round(cor(val), 2) # correlations between every pair of measuresReading the matrix. Read down the total, social and emotional columns (the matrix is symmetric, so the rows give the same values). The convergent correlations for the total are 0.45 with the UCLA scale and −0.49 with perceived social support (negative because more support goes with less loneliness), and the discriminant correlation with anxiety is lower at 0.33. The social subscale correlates −0.48 with support and 0.21 with anxiety. The emotional subscale correlates −0.26 with support and 0.32 with anxiety. The two subscales correlate 0.21 with each other.
friends <- data$CONNECTION_social_num_close_friends_grouped
friends[friends == "Presented but no response"] <- NA
friends <- factor(friends, levels = c("None", "1–2", "3–4", "5 or more"))
table(friends)               # people in each group
round(tapply(social, friends, mean, na.rm = TRUE), 2) # mean social scoreThe grouping variable is set as a factor with its levels in order, so that the groups print from fewest to most friends, and the 20 people who saw the question without answering it become NA. The smallest group, people with no close friends, has 179 people. The last line gives the mean social subscale score (0 to 3) in each group: social loneliness falls from 2.47 among people with no close friends to 1.13 among those with five or more. Question 3 asks you to run the same line with emotional in place of social.
R Reflect on what you just ran
Answer each question from your own output, as on the final exam: name the kind of evidence, say whether it supports the scale, and check it against the prediction made before the analysis.
1. Using the correlations of the total score with the UCLA Loneliness Scale, perceived social support and anxiety symptoms, name the kind of validity evidence that each correlation provides, and say whether the pattern supports the scale.
2. Before the analysis, Amira predicted that the social subscale would correlate more strongly with perceived social support than the emotional subscale does. Report the two correlations and say whether they support the prediction. Why should the comparison be read with some caution?
3. Run your own code: at the end of the script, copy line 31, change social to emotional and run it. Name the kind of validity evidence that the gradients of the two subscales provide, and say whether they support the subscales. Why does the difference in the size of the two gradients fit Weiss's distinction between social and emotional loneliness? Before a report compares mean scores between groups, what must be true of the scale?
Your output from Activity 7.3 reproduces the correlations and the known-groups gradients interpreted in 5.6. With the kinds of evidence, the COSMIN headings and these results in place, the task below shows how they are assembled into a validity argument for a Measures paragraph, drawing on a measure's published sources and on an analysis of the CSCS data.
Choose one multi-item measure in the CSCS (for example, the De Jong Gierveld scale, the three-item UCLA Loneliness Scale, the Multidimensional Scale of Perceived Social Support, the PHQ-2 or the GAD-2). First, state the interpretation and use in one sentence, naming the population. Second, find the scale's original development paper and, if one exists, a validation study in a population like the CSCS sample, and note the evidence each provides under the COSMIN headings (content, structural, hypothesis testing, criterion, reliability). Third, note what an analysis of the CSCS data adds: internal consistency in the study sample, and one or two pre-stated correlations or group differences. Fourth, record what is missing, such as test-retest evidence or measurement invariance across the groups being compared. The result is a table of four rows that becomes two or three sentences of a Measures paragraph like the one drafted in Section 4 (Worked Example 7.2).
This section has separated validity from reliability, classified the kinds of validity evidence, treated validity as an argument for a particular use of scores in a particular population, organized the evidence with the COSMIN taxonomy, and gathered construct validity evidence for the De Jong Gierveld scale from the CSCS. Structural validity, the evidence that the reviewer's first question calls for, requires a latent variable model, and Section 4 introduces the models used to test it. The key takeaways below draw the section together before its knowledge check.
Key Takeaways
- 5.1 Reliability and validity answer different questions, and keeping them apart is one of the most useful habits in this lesson. Reliability concerns random error, the scatter of scores around each person's true score, whereas validity concerns systematic error, that is, whether the score measures the intended construct for its stated use. A score can be consistent and consistently wrong, like a bathroom scale that always reads 2 kg heavy, so reliability is necessary for validity and never enough to establish it. The link runs one way only: a score that is mostly random error cannot correlate strongly with anything, so low reliability limits validity, but a highly reliable loneliness score could still mainly measure general distress. When a question claims that a measure is valid because its alpha is high, explain that alpha shows consistency only and that validity needs evidence of its own.
- 5.2 Each kind of validity evidence supports a different claim, so the skill on an exam is to match the evidence in front of you to the question it answers. Content evidence asks whether the items cover all of the construct and nothing else, usually as judged by experts, and face validity, the weakest kind, asks whether the items look relevant to the people answering them. Criterion evidence compares scores with a gold standard measured at the same time (concurrent) or later (predictive); for a cut-point it is summarized with the sensitivity, the share of people with the condition whom the cut-point flags, and the specificity, the share of people without it whom the cut-point correctly does not flag. Construct evidence asks whether scores relate to other variables as theory predicts: a strong correlation with a measure of the same or a closely related construct is convergent evidence, a clearly weaker correlation with a related but distinct construct is discriminant evidence, and a difference in the predicted direction between groups expected to differ is known-groups evidence. Structural evidence asks whether the items form the intended domains, and it comes from factor analysis or item response theory. For constructs such as loneliness there is no gold standard, so the argument rests mainly on content, construct and structural evidence.
- 5.3 Current measurement theory does not treat validity as a stamp that a scale either has or lacks. Validity is an argument for a stated use in a stated population, built from content, criterion, construct and structural evidence. You build it in two steps: state the interpretation and use (for example, that scores rank adults in an online Canadian survey by their degree of loneliness), then gather evidence for each claim on which that interpretation depends, and the argument keeps growing as each new study reports how the scores behave. That is why a scale should not simply be called "validated": evidence from the population in which a scale was developed supports, without settling, its use in a different population or for a different purpose. When a question asks you to rewrite "a validated scale", state what the evidence supports, for which use and in which population, and say what is missing, such as test-retest evidence when the data come from a single survey.
- 5.4 The COSMIN taxonomy gives you a ready-made set of headings for organizing everything that is known about an instrument. It groups measurement properties into three domains: reliability (internal consistency, reliability over occasions or raters, and measurement error), validity (content validity including face validity, criterion validity, and construct validity, which covers structural validity, hypothesis testing and cross-cultural validity) and responsiveness (whether scores change when the construct changes), with interpretability, such as what size of change matters, beside them. Use it as a checklist: for each property, note whether the evidence comes from published studies or from your own data, and which properties your design cannot assess. For the De Jong Gierveld scale in the CSCS, for example, internal consistency, structural validity and hypothesis testing can be assessed from the data, whereas stability over time must come from published studies, there is no gold standard for criterion validity, and responsiveness needs longitudinal data.
- 5.5 Statistical significance tells you whether a difference is likely to be real, not whether it matters, and the minimal important difference (MID) fills that gap: it is the smallest change in scores that people would regard as important. An anchor-based estimate links score changes to an outside judgement, such as the mean change among participants who say their loneliness is "a little better", and it is preferred because it speaks directly to importance. Distribution-based estimates, half a standard deviation of the baseline scores or one standard error of measurement (SEM = SD × √(1 − reliability)), describe a change relative to the spread and the error of the scores, so they serve as checks. To judge a difference in a question, line it up against every MID estimate you are given: in the lesson's example, a fall of 0.4 points is below the anchor-based MID of 1.0 and the distribution-based values of 0.8, so it is not important even if a large trial finds it statistically significant.
- 5.6 Construct validity evidence is convincing only when the predictions are written down before the results are seen (COSMIN calls this hypothesis testing), so begin any answer by stating what theory expects. In Activity 7.3 the predictions held: the De Jong Gierveld total correlates 0.45 with the UCLA scale and −0.49 with perceived social support (convergent evidence; the sign is negative because more support goes with less loneliness) but only 0.33 with anxiety (discriminant evidence), and the subscale scores fall as the number of close friends rises (known-groups evidence), more steeply for social loneliness (2.47 to 1.13) than for emotional loneliness (2.45 to 1.74), as Weiss's distinction predicts. When you read a correlation matrix, judge the convergent correlations by their absolute size, and remember that a discriminant correlation only needs to be clearly lower than the convergent ones, not zero. Read these correlations with care, too, because they are themselves weakened by unreliability, so the lower reliability of the emotional subscale may explain part of its weaker correlations.
- 5.7 Whenever you compare mean scores between groups, such as older and younger adults, you are quietly assuming measurement invariance: that the items relate to the construct in the same way in each group. If younger adults read "I miss having people around me" differently from older adults, a difference in means could come from the item's wording rather than from a real difference in loneliness. Invariance is tested by fitting the confirmatory factor model of Section 4 in each group and checking whether the loadings and item intercepts are equal, which goes beyond this lesson. In practice, and in an exam answer, say that the comparison assumes invariance, cite published invariance evidence where it exists, and note any comparison for which it is missing.
1. A clinic's scale always reads exactly 2 kg heavier than a person's true weight, and two readings of the same person taken a minute apart never differ by more than 0.1 kg. A nurse writes that "the readings are reliable, so they are valid measures of weight." Which statement is correct?
2. A two-item anxiety screener is given to 300 clinic patients, and in the same week a psychologist who has not seen the screener results carries out a structured diagnostic interview with each patient. Against the interview, a screener score of 3 or more has a sensitivity of 0.80 and a specificity of 0.85. Which statement is correct?
3. Before running Activity 7.3, Amira wrote down her predictions: the De Jong Gierveld total should correlate positively with the UCLA Loneliness Scale, negatively with perceived social support and less strongly with anxiety symptoms, and social loneliness should be lower among people with more close friends. The output is summarized below. Which interpretation is best?
| Result in the CSCS (3,053 people) | Value |
|---|---|
| Correlation of the total with the UCLA Loneliness Scale | 0.45 |
| Correlation of the total with perceived social support | −0.49 |
| Correlation of the total with anxiety symptoms (GAD-2) | 0.33 |
| Mean social subscale score (0 to 3): no close friends, 1–2, 3–4, 5 or more | 2.47, 2.08, 1.78, 1.13 |
4. A self-efficacy scale was developed in 2015 with university students, and content, convergent and structural evidence supported its use in research comparing groups of students. A health authority now wants to use its scores to decide which older adults in long-term care are offered a coaching program. A colleague says: "The scale was validated in 2015, so no further evidence is needed." Which response is best?
5. A team plans to compare the mean loneliness scores of English-speaking respondents, who answered a scale in English, and French-speaking respondents, who answered a French translation. Before comparing the means, what should the team show, and where does the COSMIN taxonomy place that evidence?
6. A loneliness scale has a reliability of 0.84. In a follow-up survey, participants who said they felt "a little less lonely" had improved by 2.5 points on average. A community program lowers the mean score by 1.2 points compared with a control group (p = 0.02). The analyst prints the two distribution-based checks in R from the baseline scores. Is the change important?
> sd(base$lonely)
[1] 4
> sd(base$lonely) / 2               # half an SD
[1] 2
> sd(base$lonely) * sqrt(1 - 0.84)  # SEM
[1] 1.6
7. A falls-prevention program uses a published seven-item Fear of Falling Scale with adults aged 70 and over. In its sample the alpha is 0.91, and, as predicted, the score correlates strongly with a question on worry about falling and is higher among people who have fallen. A colleague writes: "Because alpha is 0.91, the scale is valid, so we can compare the mean scores of women and men." Which response identifies the problems with this sentence?
Latent Variable Models: Factor Analysis and Item Response Theory
Parallel analysis suggests two factors
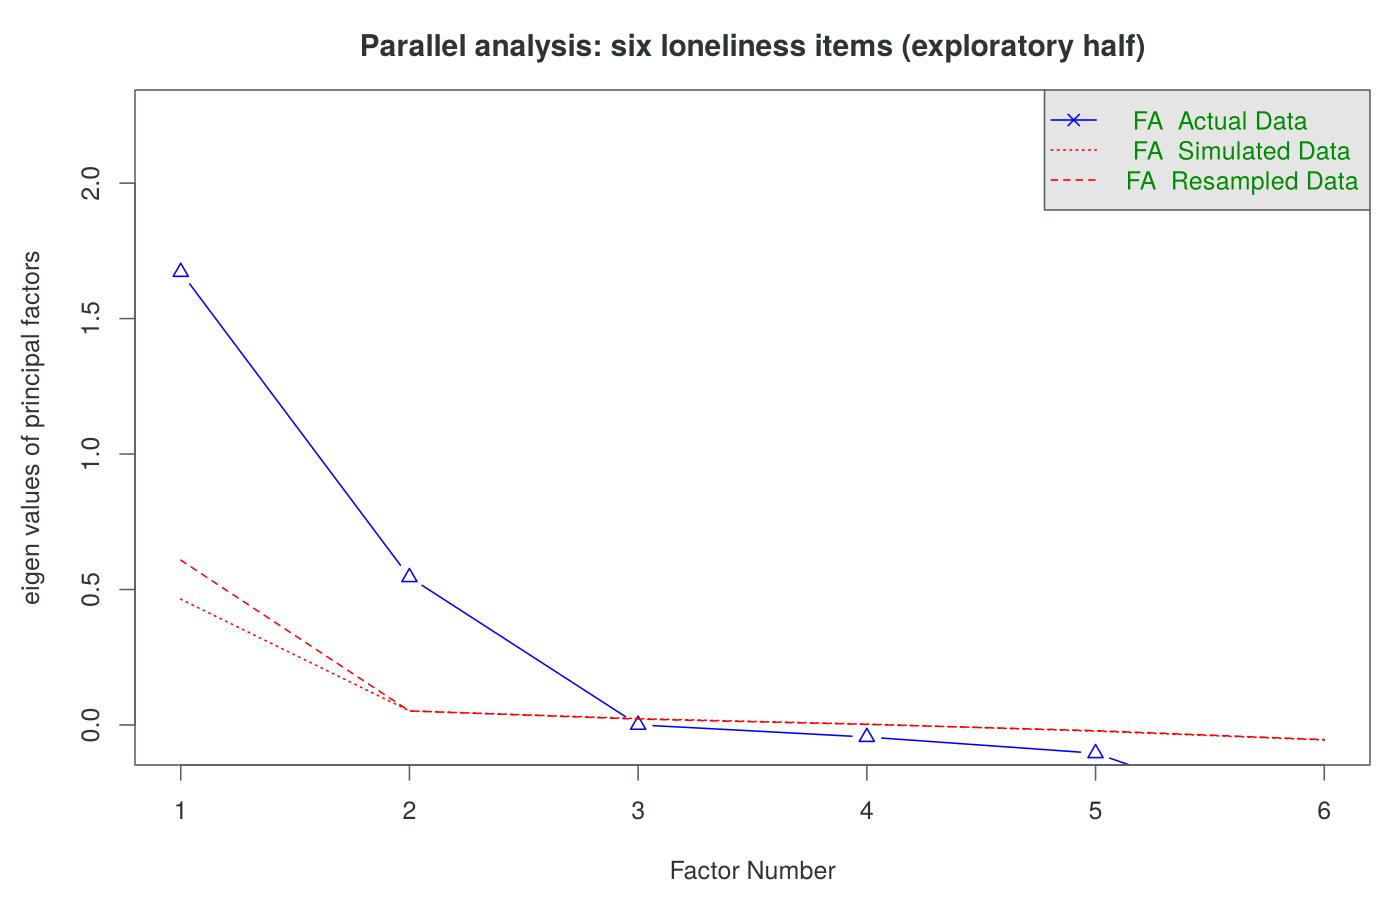
- The overall KMO is 0.68, which is adequate.
- Parallel analysis keeps two factors.
- Oblimin rotation allows the factors to correlate (r = 0.29).
- The miss item loads below 0.3 on both factors.
Where on the trait do the items measure well?
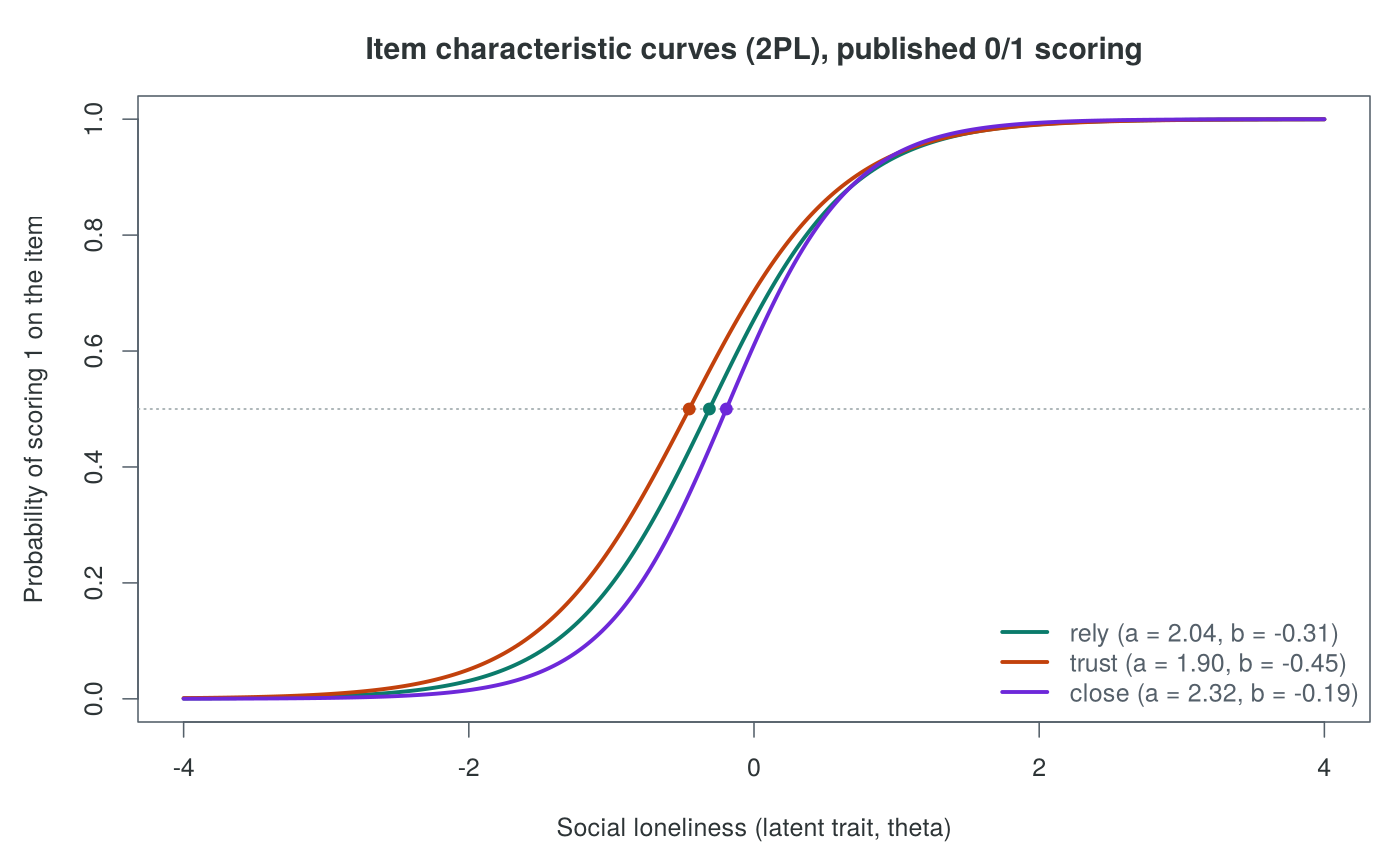
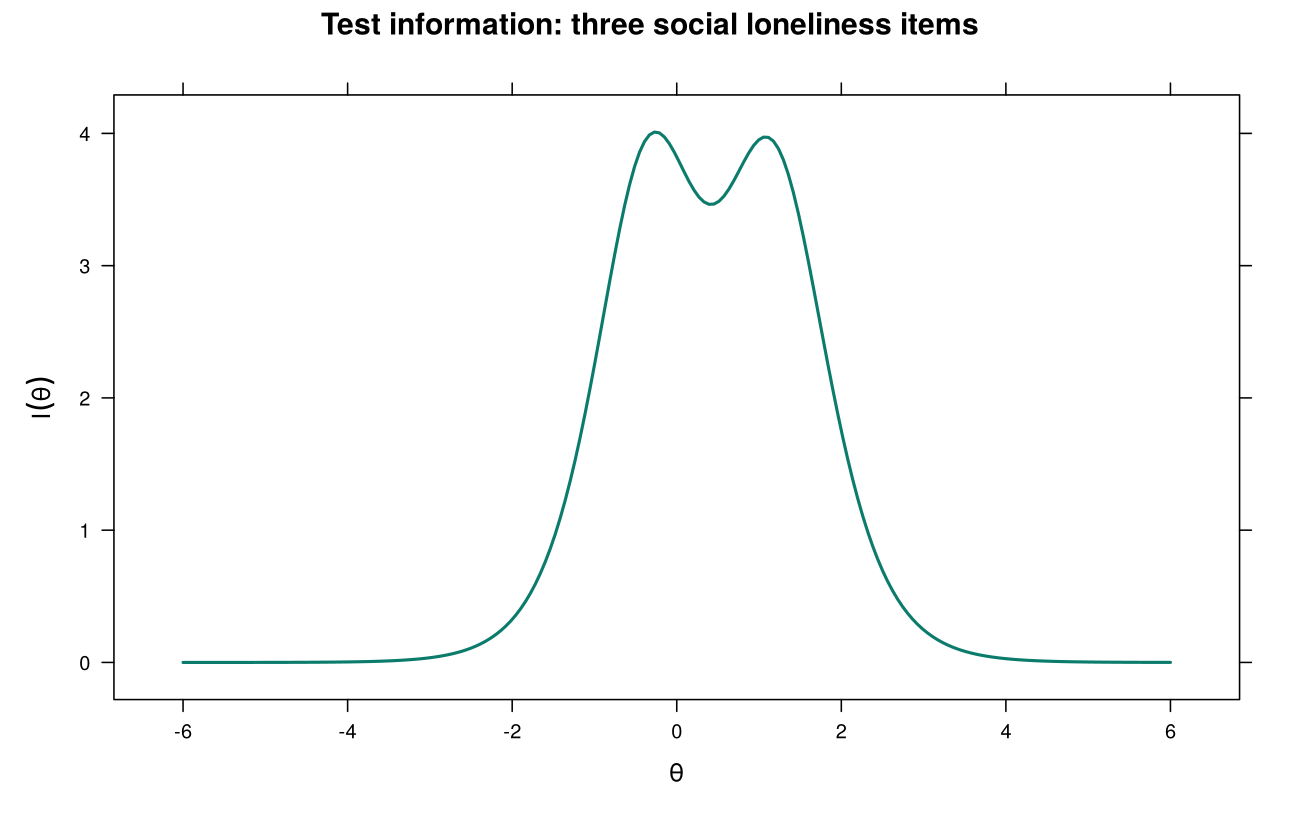
Overview
Sections 2 and 3 produced two hints that the six De Jong Gierveld items do not form a single construct: the six-item alpha (0.59) is lower than the alpha of the social subscale alone (0.75), and the two subscales correlate only 0.21 and relate differently to other measures. A latent variable model can test this directly. This section teaches the common factor model, exploratory factor analysis (EFA), which lets the data suggest a structure, and confirmatory factor analysis (CFA), which tests a structure stated in advance, and it shows how the results decide how the scale is scored and reported in the Measures paragraph of Amira's revised manuscript. It then introduces item response theory (IRT) at a conceptual level, using curves estimated from the loneliness items, and compares how IRT and classical test theory describe precision.
Learning Objectives
- 6.1 Describe the common factor model, and interpret a standardized loading and its communality.
- 6.2 Explain why the sample is split at random before a structure is explored and then confirmed.
- 6.3 Interpret an exploratory factor analysis in R: factorability (the KMO and Bartlett tests), the number of factors from parallel analysis, an oblique rotation and the loading matrix, including weak and cross-loading items.
- 6.4 Interpret a confirmatory factor analysis fitted in lavaan: judge fit with the chi-square test and the CFI, TLI, RMSEA and SRMR, read the standardized loadings, and compare one-factor and two-factor models.
- 6.5 Explain what the structural results mean for how a scale is scored, and report the structure and reliability of a scale in a Measures paragraph.
- 7.1 Explain item difficulty, item discrimination, item characteristic curves and test information, and distinguish the Rasch, two-parameter and graded response models.
- 7.2 Compare how item response theory and classical test theory describe precision.
The part on latent class analysis near the end of this section is optional enrichment: it introduces a related model and is not one of the lesson objectives.
6.1 The Common Factor Model
A factor model treats the answer to each item as the sum of two parts: a part caused by a latent factor that the items share, and a unique part that belongs to the item alone (Spearman, 1904; Thurstone, 1947). By this we mean that when a person answers "I experience a general sense of emptiness", part of their answer reflects their level of emotional loneliness, which also shapes their answers to the other emotional items, and part reflects things that affect only this item, such as how they interpret the word "emptiness". The loading λ describes how strongly the item depends on the factor. When the items and the factor are standardized, the loading is the correlation between the item and the factor, and its square is the share of the item's variance that the factor explains, called the communality. The rest is the unique variance, which includes measurement error and anything specific to the item's wording. Because the two parts add up to the whole, a high communality and a low unique variance go together, and both describe an item that is a good indicator of the factor. Equation 7.9 writes the model for one standardized item.
emptiness, whose standardized loading is 0.82, and only 0.041, about 4%, for miss, whose loading is 0.20.Squaring is the step most often forgotten: a loading that sounds moderate corresponds to a much smaller share of explained variance, which is why R's R-Square output, rather than the loading itself, is read when the question is how much of an item the factor explains. Figure 7.6 draws the two-factor model of the De Jong Gierveld scale, with the standardized loadings and the factor correlation from the confirmatory model fitted in 6.4.
Factor analysis and the reliability statistics of Section 2 rest on the same reflective model, so they answer related questions. Alpha and omega summarize how well a set of items measures whatever they share, assuming there is one thing they share. Factor analysis asks how many things they share and which items measure each one. A factor model can be used either to find out how many factors a set of items share or to test a structure stated in advance, and the next subsection describes both uses and the order in which Amira applies them.
6.2 Exploratory and Confirmatory Factor Analysis
Exploratory factor analysis lets every item load on every factor and estimates the loadings from the data. It is used when the structure is unknown, for example when a new scale is being developed, and it suggests how many factors there are and which items belong together. Confirmatory factor analysis tests a structure stated in advance: each item loads only on the factor the theory assigns it to, and all other loadings are fixed at zero. A confirmatory model can be rejected by the data, which makes it the stronger test of a published scale's structure.
The two analyses should not be run on the same people. Every sample contains some chance patterns, small correlations that arise from the particular people who happened to take part and would not appear in another sample. An exploratory analysis cannot tell these chance patterns from real structure, so the structure it suggests is partly shaped by them. If the confirmatory model were then tested in the same data, it would fit those same chance patterns again and appear to be confirmed, even if part of what it found would not hold in new data. In other words, exploring and confirming in the same data would let the confirmatory model reward whatever the exploration happened to find. Testing the structure in a separate half of the sample avoids this, because the chance patterns of the first half are not repeated in the second. Amira therefore splits the 3,415 participants at random into two halves of 1,708 and 1,707, explores in the first and confirms in the second. The split uses set.seed(2021) before sample(), so that it is the same every time the code is run and the results can be reproduced, and it matches the split in the Factor Analysis and Scale Scoring walkthrough. The next subsection describes the exploration in the first half.
6.3 Exploratory Factor Analysis in Four Steps
An exploratory factor analysis proceeds in four steps, and the same order is the easiest way to read its output. The first step checks that the items are suitable for factor analysis, with the Kaiser-Meyer-Olkin (KMO) measure and Bartlett's test; in the exploratory half the KMO is 0.68, above the practical minimum of about 0.6. The second chooses the number of factors with parallel analysis, which here suggests two. The third rotates the solution, and because emotional and social loneliness are expected to be related, an oblique rotation is used. The fourth reads the loading matrix: the three social items load on one factor, emptiness and rejection on the other, the item about missing people loads weakly on both, and the two factors correlate 0.29.
The accordion below gives the detail of each step, the guides used to judge it and the values from the exploratory half. Expand each step in turn: Step 2 contains the parallel analysis plot (Figure 7.7), and Step 3 contains a callout that examines the varimax rotation and asks a short question.
Factor analysis needs items that correlate, because a factor is defined by what the items share. The Kaiser-Meyer-Olkin (KMO) measure of sampling adequacy checks whether the items share enough. It compares the correlations between items with their partial correlations, which are the correlations that remain between two items once all the other items are held constant. If the items share common factors, much of the correlation between any two items runs through what they share with the rest, so the partial correlations are small compared with the ordinary correlations and the KMO is high. If instead the items correlate only in isolated pairs, the partial correlations stay large and the KMO is low. Kaiser (1974) labelled values of 0.90 or above "marvelous", values in the 0.80s "meritorious", the 0.70s "middling", the 0.60s "mediocre", the 0.50s "miserable" and values below 0.50 "unacceptable", and about 0.6 is often treated as a practical minimum. Bartlett's test of sphericity tests whether the correlation matrix differs from one in which all correlations are zero; with samples of this size it is almost always significant, so it is a minimal check. For the exploratory half, the overall KMO is 0.68 and Bartlett's test gives a chi-square of 1,912 on 15 degrees of freedom (p < 0.001).
Each factor has an eigenvalue that describes how much of the items' variance it explains, with larger eigenvalues for factors that account for more of the shared variation. The old rule of keeping every factor with an eigenvalue above 1 (the Kaiser criterion) often keeps too many factors. The problem is that even random data with no real structure produce some eigenvalues above 1, simply because chance correlations in a finite sample always give the first few factors something to explain. Parallel analysis (Horn, 1965) addresses this by asking how large each eigenvalue would be if there were no structure at all. It generates random data with the same number of people and items, computes their eigenvalues, and compares each eigenvalue from the real data with the corresponding random one. A factor is kept only if its eigenvalue exceeds the random one, because only then does it explain more than chance alone would. For the loneliness items, two eigenvalues lie above the random line, and fa.parallel() reports that "the number of factors = 2".
An unrotated solution is hard to read, because most items load on the first factor. The first factor is extracted to explain as much variance as possible, so it tends to pick up a little of every item, and the second factor is left with what remains. Rotation turns the factors so that each item loads strongly on as few factors as possible. By this we mean that rotation does not change how well the model fits the data or how much variance the factors explain together; it only changes how that explained variance is divided between the factors, choosing the division that makes each factor easiest to name. An orthogonal rotation, such as varimax, keeps the factors uncorrelated. An oblique rotation, such as oblimin, allows them to correlate. Constructs in health research are usually related, and emotional and social loneliness are expected to be, so an oblique rotation is the usual choice. If the factors turn out to be uncorrelated, an oblique rotation gives nearly the same answer as an orthogonal one.
A Closer Look: The Varimax Rotation
A two-factor analysis of the depression and anxiety items of the course dataset with a varimax rotation forces the factors to be uncorrelated. Depression and anxiety are expected to correlate, so an oblique rotation such as oblimin is the better choice for those items, as it is for emotional and social loneliness. A factor loading is often defined as the correlation between an item and a factor. That holds only in a one-factor or an orthogonal solution. In an oblique solution, the reported (pattern) loading is the item's weight on one factor with the other factors held constant, and it differs from the item-factor correlation whenever the factors correlate.
Question. What does an oblique solution report that a varimax solution cannot?
Each row of the loading matrix is an item and each column is a factor. Loadings below about 0.3 are often hidden to make the pattern clearer. A clean structure has each item loading strongly on one factor and weakly on the others. An item that loads weakly on every factor measures little of what the others share, and an item that loads strongly on two factors (a cross-loading) is ambiguous. Factors are named from the content of the items that load on them, because labels such as MR1 and MR2 only number the factors. An item that cross-loads, or loads weakly everywhere, is not dropped automatically: its wording is reviewed for content that touches both domains, and the way it behaves is checked in the confirmatory half of the sample before any decision. In a published scale the item is usually kept and reported, whereas in a scale still under development it may be reworded or removed. In the loneliness data, the three social items load 0.71, 0.74 and 0.68 on the first factor, emptiness and rejection load 0.86 and 0.56 on the second, and the item about missing people loads below 0.3 on both. The two factors correlate 0.29.
Activity 7.4, at the end of 6.4, carries out these four steps in R on the exploratory half of the sample. Its output supplies the values quoted in the accordion, and its call to fa.parallel() draws the plot in Figure 7.7. The exploratory half points to two correlated factors, with the three social items on one, emptiness and rejection on the other, and the item about missing people loading weakly on both. The next subsection tests this structure in the confirmatory half of the sample.
6.4 Confirmatory Factor Analysis in lavaan
A confirmatory analysis has three parts: writing the model, judging how well it fits, and comparing it with a rival model while reading each item's loading.
6.4.1 Writing the Model in lavaan
The lavaan package (Rosseel, 2012) fits confirmatory factor models and structural equation models. A model is written as text, with one line per factor. The operator =~ is read as "is measured by", so social =~ rely + trust + close says that the social factor is measured by those three items. A latent factor has no natural scale. By this we mean that, because the factor is never observed, nothing in the data says whether it should be measured in units like the item codes, in standard deviations, or in any other unit, so the model cannot be estimated until a unit is chosen. To solve this, lavaan fixes the first loading of each factor at 1 by default, which gives the factor the same units as its first item, and the other loadings are then estimated relative to it. This changes how the unstandardized output should be read: the 1.000 in the Estimate column is a choice made to set the scale, not a result, and it is therefore not a sign of a strong item. The standardized loadings (Std.all in the output) are on a common scale and are the values usually reported. With rsquare = TRUE, the summary also prints each item's communality in an R-Square section, and the Std.all value under Variances gives each item's unique variance.
6.4.2 Judging Model Fit
A confirmatory model implies a pattern of correlations among the items. By this we mean that once the loadings and the factor correlation are estimated, the model predicts how strongly every pair of items should correlate. For example, two items that load on the same factor are predicted to correlate according to the product of their loadings, and two items on different factors are predicted to correlate only through the correlation between the factors. Fit statistics measure how closely this implied pattern matches the correlations actually observed in the data. The chi-square test asks whether the misfit could be due to chance. Its weakness is its sensitivity to sample size: with large samples it has the power to detect even tiny differences between the implied and observed correlations, so it rejects almost every model, including models with trivial misfit. For this reason it is reported but rarely decisive. Four indices are usually reported alongside it. The guides for good fit used in this course follow Hu and Bentler (1999), who proposed values close to 0.95 or higher for the CFI and TLI, close to 0.06 or lower for the RMSEA and close to 0.08 or lower for the SRMR. The description of an RMSEA up to 0.08 as acceptable follows Browne and Cudeck (1993), who called such values a reasonable error of approximation. They are rules of thumb, and a model near a guide is better described as borderline than as passing or failing.
Table 7.3 lists the four indices, what each one measures and its guide for good fit, together with the values for the two-factor and one-factor models of the loneliness items that Activity 7.4 produces. Compare each value with its guide before reading the next paragraph.
Table 7.3. Four fit indices for a confirmatory factor model, with the values for the two-factor and one-factor models of the De Jong Gierveld items.
| Index | What it measures | Guide for good fit | Two-factor model | One-factor model |
|---|---|---|---|---|
| Comparative fit index (CFI) | Improvement over a model in which no items are related | 0.95 or higher | 0.949 | 0.739 |
| Tucker-Lewis index (TLI) | The same comparison, with a penalty for model complexity | 0.95 or higher | 0.905 | 0.565 |
| Root mean square error of approximation (RMSEA) | Misfit per degree of freedom | 0.06 or lower; up to 0.08 often called acceptable | 0.082 (90% CI 0.068 to 0.097) | 0.177 |
| Standardized root mean square residual (SRMR) | Average gap between observed and implied correlations | 0.08 or lower | 0.060 | 0.110 |
The two-factor model meets the guide for the SRMR (0.060) but falls short of good fit on the other three indices: the CFI (0.949) is just below 0.95, the TLI (0.905) is below it, and the RMSEA (0.082) is just above even the 0.08 often called acceptable. Its fit is therefore best described as acceptable or borderline, rather than good. The one-factor model fails every guide.
6.4.3 Comparing Models and Reading Each Item
Two models fitted to the same data can be compared directly. When one model is a special case of the other, the two models are said to be nested. For example, the one-factor model is the two-factor model with the factor correlation fixed at 1, because two factors that correlate perfectly are in effect a single factor. For nested models a chi-square difference test asks whether freeing that restriction improves fit by more than chance would, and the AIC and BIC can also be compared, with lower values preferred because they reward fit while penalizing extra parameters. These comparisons are made with anova() in Activity 7.4, where every comparison favours the two-factor model (a chi-square difference of 386.95 on 1 degree of freedom; AIC 20,825 against 21,210).
Good overall fit describes the model as a whole, not each item. Fit indices ask whether the model reproduces the pattern of correlations among the items, and an item that correlates weakly with everything is reproduced well by a small loading, so a model can fit well while one item measures its factor poorly. The standardized loadings (Std.all) are therefore read item by item alongside the fit indices, and the weakest item is the one with the smallest standardized loading. In the confirmatory half, miss has a standardized loading of 0.20, against 0.57 to 0.82 for the other items, and its R-Square is only 0.041.
The card below links again to the narrated walkthrough introduced in Section 2, which also demonstrates both factor analyses on these items and may help before you run the activity.
Narrated R walkthrough: Factor Analysis and Scale Scoring
The Factor Analysis and Scale Scoring walkthrough demonstrates the exploratory and confirmatory analyses on these items line by line with narration, including the parallel analysis plot, the reading of the loading matrix and each part of the lavaan summary.
Open the Factor Analysis and Scale Scoring walkthroughActivity 7.4 carries out the whole analysis of 6.2 to 6.4 in R: it splits the sample, runs the four steps of the exploratory analysis in the first half, and fits and compares the confirmatory models in the second. Run the script alongside the activity and answer its questions from your own output.
Text version of the activity: the code of the run-along script, its console output and notes on reading it.
# install.packages(c("psych", "GPArotation", "lavaan"))   # run once, if not yet installed
library(psych); library(GPArotation); library(lavaan)
load(url("https://raw.githubusercontent.com/jorgeandr3s/heal/main/cscs/public_data/CSCS2025_full_cleaned_deidentified_data_and_metadata.RData"))
data <- data[data$SURVEY_collection_year == 2021, ]   # the 2021 wave
item_names <- c("emptiness", "miss", "rejected", "rely", "trust", "close")
items <- data[, paste0("LONELY_dejong_emotional_social_loneliness_scale_", item_names)]
names(items) <- item_names
codes <- c("No" = 1, "More or less" = 2, "Yes" = 3)   # other answers become NA
items[] <- lapply(items, function(x) unname(codes[as.character(x)]))
items[, 4:6] <- 4 - items[, 4:6]   # reverse rely, trust, close: higher = lonelier
items <- na.omit(items)            # the people who answered all six items
nrow(items)
round(cor(items), 2) # correlations between every pair of itemsReading the output. The messages printed by library() say that GPArotation and lavaan mask a few psych functions; they do not affect this activity. Of the 4,045 people in the 2021 wave, 3,415 answered all six items. In the correlation matrix the three social items correlate 0.49 to 0.53 with each other and emptiness and rejected correlate 0.48, while the correlations between the two clusters are small (0.11 to 0.21). The miss item correlates weakly with every item and slightly negatively with the social items (−0.08 to −0.14).
set.seed(2021)                     # the same random split every time
efa_rows <- sample(nrow(items), size = round(nrow(items) / 2))
efa_half <- items[efa_rows, ]      # half 1: exploratory
cfa_half <- items[-efa_rows, ]     # half 2: confirmatory
c(nrow(efa_half), nrow(cfa_half))set.seed(2021) makes the random split the same every time the code is run. sample() picks 1,708 row numbers at random for the exploratory half, and the minus sign in items[-efa_rows, ] keeps the other 1,707 rows for the confirmatory half. Exploring and confirming in the same people would let the confirmatory model reward whatever the exploration happened to find.
KMO(efa_half)                      # overall MSA above 0.6 is usually adequate
cortest.bartlett(cor(efa_half), n = nrow(efa_half))
fa.parallel(efa_half, fa = "fa")   # how many factors? (it also draws a plot)
efa_2 <- fa(efa_half, nfactors = 2, rotate = "oblimin")
print(efa_2$loadings, cutoff = 0.3)   # loadings below 0.3 are hidden
round(efa_2$communality, 2)        # share of each item's variance explained
round(efa_2$Phi, 2)                # correlation between the two factors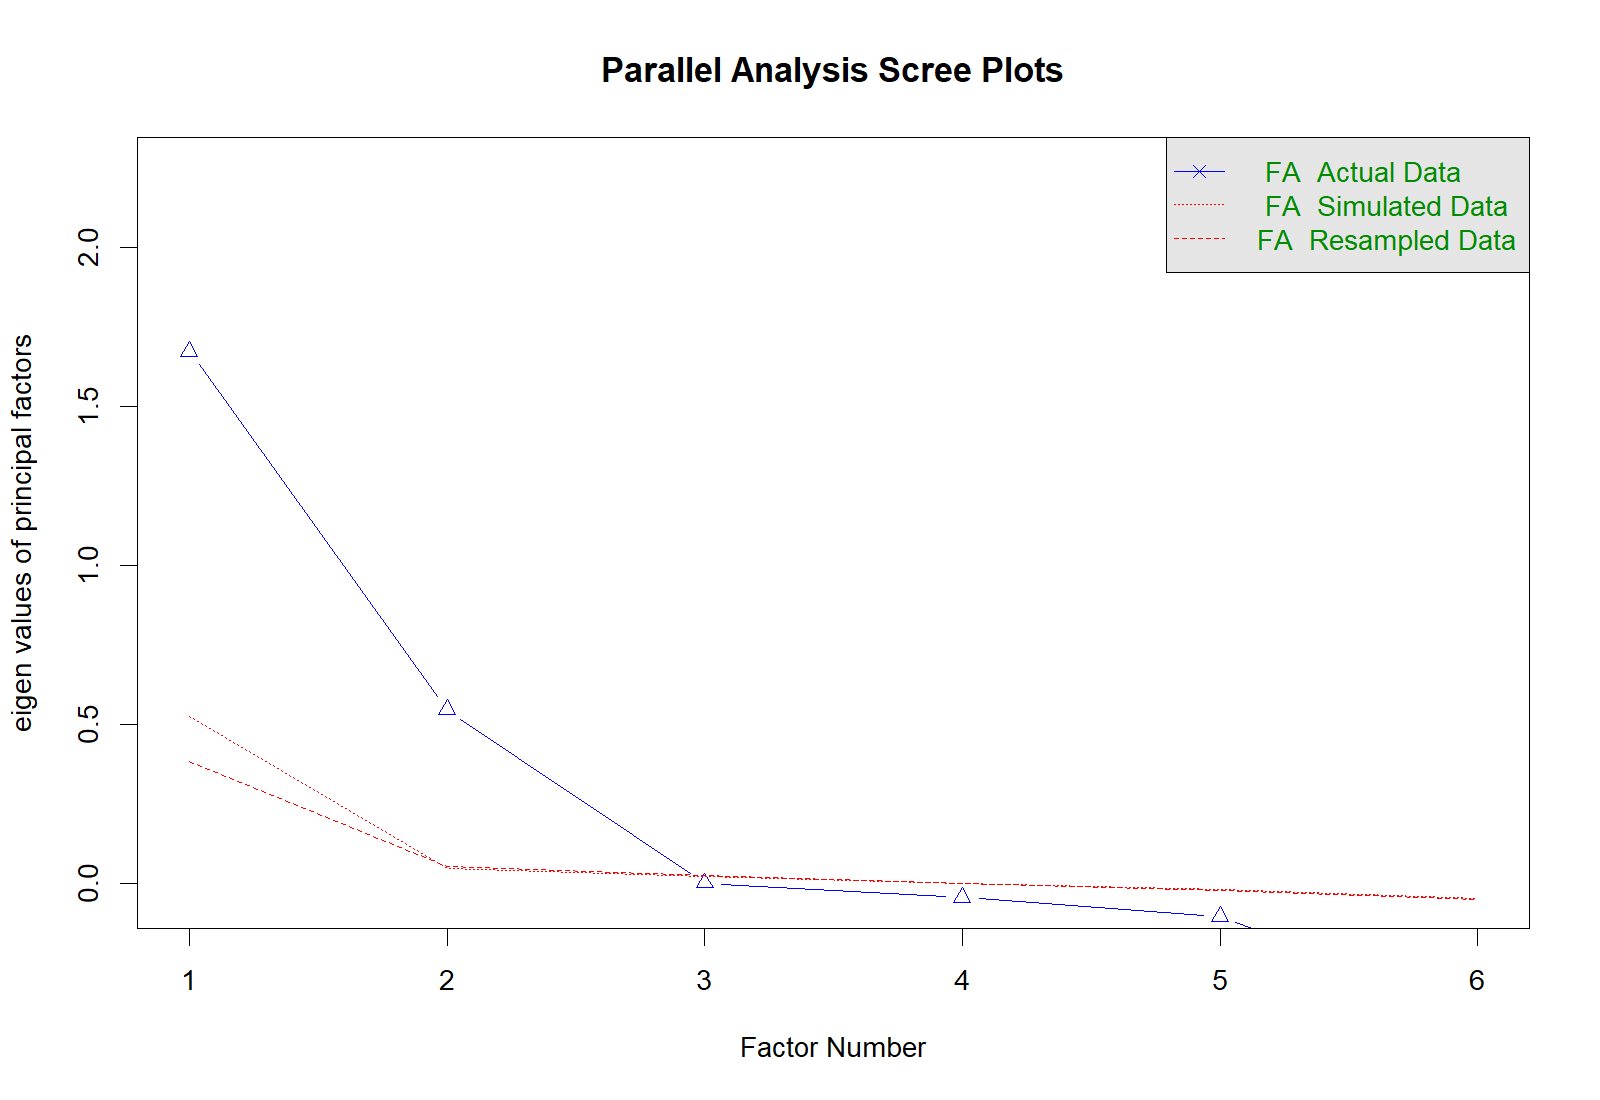
Reading the output. The overall measure of sampling adequacy (KMO) is 0.68, above the usual minimum of about 0.6, and Bartlett's test gives a chi-square of 1,912 on 15 degrees of freedom (a p-value printed as 0 means p < 0.001), so the items are suitable for factor analysis. Parallel analysis keeps the factors whose eigenvalues from the data (blue line) are larger than those from random data of the same size (red lines), which gives two factors; it reports "components = NA" because fa = "fa" asked only about factors. MR1 and MR2 only number the factors (MR stands for minimum residual, the estimation method), so the factors are named from their items: the social items load on MR2 (0.706, 0.738 and 0.682) and emptiness and rejected load on MR1 (0.859 and 0.558). The row for miss is blank because its loadings are below 0.3 on both factors, and its communality of 0.09 means that the factors explain only about 9% of its variance. Together the two factors account for 44.9% of the variance of the six items (Cumulative Var). The oblimin rotation lets the factors correlate, which suits two kinds of loneliness that are expected to be related: they correlate 0.29, whereas a varimax rotation would force this correlation to be zero.
model_2f <- '
  emotional =~ emptiness + miss + rejected
  social    =~ rely + trust + close
'
cfa_2f <- cfa(model_2f, data = cfa_half)
summary(cfa_2f, fit.measures = TRUE, standardized = TRUE, rsquare = TRUE)
fitMeasures(cfa_2f, c("cfi", "tli", "rmsea", "srmr")) # the four fit indicesReading the summary. The Model Test User Model chi-square is 100.708 on 8 degrees of freedom (p < 0.001); with 1,707 people this test rejects almost any model, so the fit indices are more informative. CFI is 0.949 and TLI is 0.905, RMSEA is 0.082 (90% CI 0.068 to 0.097) and SRMR is 0.060. (Recent versions of lavaan also print Browne's residual test and the goodness of fit index, which this course does not use.) Under Latent Variables, the first loading of each factor is fixed at 1.000 to give the factor a scale, and the Std.all column gives the standardized loadings: 0.816, 0.202 and 0.567 for the emotional items and 0.751, 0.731 and 0.651 for the social items. Under Covariances, the two factors correlate 0.254 (Std.all). Under Variances, the Std.all value for each item is its unique variance, the share of its variance that the factor leaves unexplained (0.959 for miss). rsquare = TRUE adds the R-Square section, the share of each item's variance that its factor explains (the squared standardized loading): only 0.041, about 4%, for miss, against 0.32 to 0.67 for the other items. The last line repeats the four fit indices on one line, ready for a results table.
R Reflect on what you just ran
Answer each question from your own output, as on the final exam: judge each check, name the factors from their items, and say what the results mean for how the scale is scored.
1. The sample was split at random into two halves, and the exploratory factor analysis was run on the first half (1,708 people). (i) Why was the sample split in half before the factor analysis? (ii) Are the items suitable for factor analysis, how many factors does parallel analysis suggest, and how does it decide? (iii) Name the two factors (MR1 and MR2) from the items that load on them. (iv) Which item does not belong clearly to one factor, and what would you do about it?
miss (“I miss having people around me”) does not belong clearly to either factor: its loadings are below 0.3 on both, and its communality of 0.09 means that the factors explain only about 9% of its variance. The De Jong Gierveld scale is a published scale, so miss is kept to keep scores comparable with other studies, its wording is reviewed, its behaviour is checked in the confirmatory half and it is reported as a limitation; in a new scale under development, an item like this would be reworded or removed.2. (i) Judge the fit of the two-factor model using the chi-square test and the four fit indices, with the guides taught in the course. (ii) Using the standardized loadings (Std.all) and the R-Square section of the summary, which item is most weakly related to its factor, what share of its variance does the factor explain, and how might this item help to explain the fit?
miss is most weakly related to its factor, with a standardized loading of 0.20 against 0.57 to 0.82 for the other items, and the R-Square section shows that the emotional factor explains only 0.041, about 4%, of its variance (its unique variance, under Variances, is 0.959). An item that relates weakly to its own factor, and slightly negatively to the social items, leaves correlations that the model does not reproduce well, which adds to the misfit.3. Run your own code. At the end of the script, type and run the four lines below. They fit a one-factor model, in which one factor (loneliness) is measured by all six items, to the confirmatory half and compare it with the two-factor model.model_1f <- 'loneliness =~ emptiness + miss + rejected + rely + trust + close'cfa_1f <- cfa(model_1f, data = cfa_half)fitMeasures(cfa_1f, c("cfi", "tli", "rmsea", "srmr"))anova(cfa_1f, cfa_2f)
Does the comparison support two factors or one? Use the fit indices, the chi-square difference test and the AIC and BIC. In one sentence, what do these results mean for how the scale should be scored?
Your output from Activity 7.4 contains every value quoted in 6.3 and 6.4, and its last question asks what the comparison means for how the scale is scored, the subject of the next subsection.
6.5 What the Structure Means for Scoring and Reporting
Structural results matter because they decide how a scale is scored. When a two-factor model fits well and clearly better than a one-factor model, the scale is scored and reported as two subscales, with or without the total, rather than as a single score. The results are then written up in the Measures paragraph of the manuscript.
6.5.1 One Construct or Two?
The case card below uses the results of the two factor analyses to answer the reviewer's first question, including the caveats that the data raise.
The answer to the reviewer's first question is that the items measure two related constructs. In a half of the sample that the exploration did not use, the two-factor model fits far better than a one-factor model (chi-square difference 386.95 on 1 degree of freedom, p < 0.001; AIC 20,825 against 21,210), and the one-factor model fits poorly on every index. The fit of the two-factor model is acceptable, and it falls short of good fit on three of the four indices: the SRMR (0.060) meets its guide, the CFI (0.949) is just below 0.95, and the RMSEA (0.082) and TLI (0.905) fall short of the guides for good fit. Two features of the data explain part of the misfit. The item "I miss having people around me" has a standardized loading of only 0.20, and it correlates slightly negatively with the social items. All three emotional items are worded negatively and all three social items positively, so part of what separates the factors may be the direction of wording (a method effect) as well as the two kinds of loneliness. Method effects of this kind are well documented for scales that mix positively and negatively worded items (Marsh, 1996; DiStefano & Motl, 2006), and they have been reported in confirmatory analyses of the De Jong Gierveld and UCLA loneliness scales (Penning, Liu & Chou, 2014). Amira's reply reports the two-factor result, analyzes the subscales separately in addition to the total, and states both caveats.
The answer to the reviewer is therefore two related constructs, with two caveats stated openly. The reply is completed by a Measures paragraph that reports these results together with the scoring and reliability results of Sections 1 and 2.
6.5.2 The Measures Paragraph
The Measures paragraph of a manuscript tells readers enough about each scale to judge the scores. It names the scale and its source, describes the items and response options with an example, states the scoring rule (including reverse-coding and any cut-point), describes how missing items were handled, reports the reliability observed in the study sample, and summarizes any structural or other validity evidence produced in the study. Claims such as "a validated scale" are replaced by a statement of what was validated, for what use and in which population.
Worked Example 7.2 applies this structure to Amira's manuscript, drawing on the scoring of Section 1, the reliability estimates of Section 2 and the factor analyses of this section. As you read it, notice where each element of the structure appears and how the weak item and the low reliability of the emotional subscale are carried into the analysis plan.
Worked Example 7.2: Amira's revised Measures paragraph
Loneliness. Loneliness was measured with the six-item De Jong Gierveld Loneliness Scale (De Jong Gierveld & Van Tilburg, 2006), which contains three emotional loneliness items (for example, "I experience a general sense of emptiness") and three social loneliness items (for example, "There are plenty of people I can rely on when I have problems"), each answered "yes", "more or less" or "no". Following the published scoring rule, each item was scored 1 for "more or less" or the lonely answer and 0 otherwise, taking account of the positive wording of the social items, to give emotional and social subscale scores (0 to 3) and a total score (0 to 6). Participants with any missing item (630 of 4,045) were excluded, leaving 3,415. To test the structure of the scale, the sample was split at random. In the first half (n = 1,708), parallel analysis and an exploratory factor analysis with oblimin rotation supported two factors. In the second half (n = 1,707), a two-factor confirmatory model fitted acceptably (CFI = 0.949, TLI = 0.905, RMSEA = 0.082, SRMR = 0.060) and considerably better than a one-factor model (CFI = 0.739, RMSEA = 0.177; chi-square difference = 386.95, df = 1, p < 0.001). Internal consistency, computed from the three-point item codes, was adequate for the social subscale (Cronbach's alpha = 0.75; McDonald's omega = 0.75) and low for the emotional subscale (alpha = 0.51; omega = 0.57), in which the item "I miss having people around me" loaded weakly (standardized loading 0.20). We therefore report the two subscales separately as well as the total, interpret associations with emotional loneliness as likely underestimates, and present a sensitivity analysis using the two remaining emotional items.
Worked Example 7.2 completes Amira's reply to the reviewer: it reports that the six items measure two related constructs, that the social subscale has adequate internal consistency and the emotional subscale low internal consistency, and how the analysis takes account of both findings. The callout below states the general form of the paragraph for other scales.
A Measures Paragraph for Any Multi-Item Scale
The same structure serves any multi-item scale. A Measures paragraph names the scale and cites its development paper, gives one example item and the response options, states the scoring rule and any reverse-coding, reports alpha and omega computed in the study sample, and describes how missing items were handled. When the research question depends on the subscales of a scale, or a reviewer could reasonably question its structure, it adds a confirmatory factor analysis with the four fit indices. The Factor Analysis and Scale Scoring walkthrough and the answer key for this lesson contain the code for each step.
Factor analysis has answered the reviewer's question about the structure of the scale. Item response theory, the subject of the next subsection, examines the same items one at a time and shows where along the trait each item measures well.
7.1 Item Response Theory: Item Curves, Difficulty and Discrimination
Classical test theory and factor analysis describe the scale as a whole. Item response theory (IRT) models how each item behaves along the latent trait, usually written θ (theta) and scaled so that 0 is the average and most people fall between −3 and 3 (Embretson & Reise, 2000). Each item is described by an item characteristic curve, the probability of a given answer at each level of the trait. Item response theory is presented here conceptually; the optional Worked code 7.1 at the end of 7.2 shows how the curves are estimated, and it is not assessed through code.
7.1.1 Difficulty, Discrimination and Three Item Models
For an item scored 0 or 1, the two-parameter logistic (2PL) model describes the curve with two numbers. The difficulty b is the trait level at which the probability of the keyed answer (here, the lonely answer) is 0.5. The name comes from educational testing, where a difficult question is one that only students of high ability answer correctly; for a loneliness item, "difficulty" means how lonely a person must be before they are more likely than not to give the lonely answer. An item with a high b is therefore endorsed only by people high on the trait, and if b is below 0, a person of average trait level has a probability above 0.5 of giving the keyed answer. The discrimination a is the steepness of the curve at that point. By this we mean how quickly the probability of the keyed answer changes as the trait increases. An item with a high a separates people just below b from people just above it sharply, because their probabilities of the keyed answer differ a great deal, and an item with a low a separates them weakly, because its curve rises so gradually that people at quite different trait levels answer in similar ways. Item response models differ in which of these features they allow to vary between items. The Rasch model (Rasch, 1960), also called the one-parameter model, gives every item the same discrimination. Because every item then carries the same weight when a person's trait level is estimated, it does not matter which items a person endorsed, only how many, and the total score carries all the information the answers contain about a person's trait level, which is what is meant by calling it a sufficient summary. The two-parameter model (Birnbaum, 1968) lets discrimination vary between items. The graded response model (Samejima, 1969) extends the 2PL to items with ordered categories, such as "No", "More or less" and "Yes", by estimating one discrimination per item and one threshold for each boundary between adjacent categories.
Equation 7.10 gives the 2PL item characteristic curve and the information that an item provides at each level of the trait, a quantity that 7.2 uses to describe precision.
The explorer in Interactive 7.2 draws the curve for any combination of a and b, together with the item's information. Move the discrimination slider and watch the curve become steeper and the information peak taller and narrower; then move the difficulty slider and watch both slide along the trait.
📊 Interactive 7.2: Explorer: an item characteristic curve and its information
The three social loneliness items, scored 0 or 1, have a between 1.90 and 2.32 and b between −0.45 and −0.19.
Probability of the keyed answer Item information (scaled so that a = 3 fills the plot)
7.1.2 Curves for the Social Loneliness Items
Figures 7.8 to 7.10 come from the CSCS data. Figure 7.8 shows 2PL curves for the three social items scored 0 or 1 by the published rule. All three curves are steep (a between 1.90 and 2.32) and cross 0.5 close together (b between −0.45 and −0.19). The three items therefore behave almost interchangeably: each one separates people just below the middle of the trait from people just above it, and none of them distinguishes well among people who are very connected or very isolated.
A graded response model keeps all three answer categories. It gives each item a discrimination and two thresholds: b1, the trait level at which a person becomes more likely than not to give "More or less" or the lonely answer, and b2, the level at which the lonely answer itself becomes more likely than not. For the three social items, b1 lies between −0.43 and −0.21 and b2 between 0.99 and 1.31, so all three items measure the same part of the trait. The next subsection shows what these thresholds mean for the precision with which the items measure each person.
7.2 Precision in Item Response Theory and Classical Test Theory
The most practical difference between the two frameworks is how they describe precision. Classical test theory gives one reliability, such as alpha or omega, for everyone in the sample, which implies that the scale measures a very lonely person as precisely as a moderately lonely one. Item response theory instead gives precision that varies along the trait. The reasoning runs in three steps. First, each item's information peaks near its difficulty or thresholds, because an item is most useful for telling apart people whose trait levels sit near the point where its curve rises most steeply; for people far above or far below that point, almost everyone gives the same answer, so the item tells us little. Second, the items' information adds up to the test information curve, which shows how much the whole set of items tells us at each trait level. Third, the standard error of a person's estimated trait is 1 / √(test information), so it is small where the items measure well and large where they do not. In other words, a scale can be precise for some people and imprecise for others, and a single reliability coefficient hides this. For the three social items, the test information is high between a θ of about −1 and 2, with two peaks that correspond to the two sets of thresholds, and it falls toward zero below about −2 and above about 3. Where the information is about 4, the standard error is about 0.5, whereas information near zero gives a very large standard error, so the items distinguish poorly among people who are very connected or very isolated.
The two tabs below show the graded response model results. Open the first tab for the test information curve just described (Figure 7.9), and the second for the category curves of each item (Figure 7.10), whose crossing points are the thresholds that produce the two information peaks.
plot(grm, type = "info")).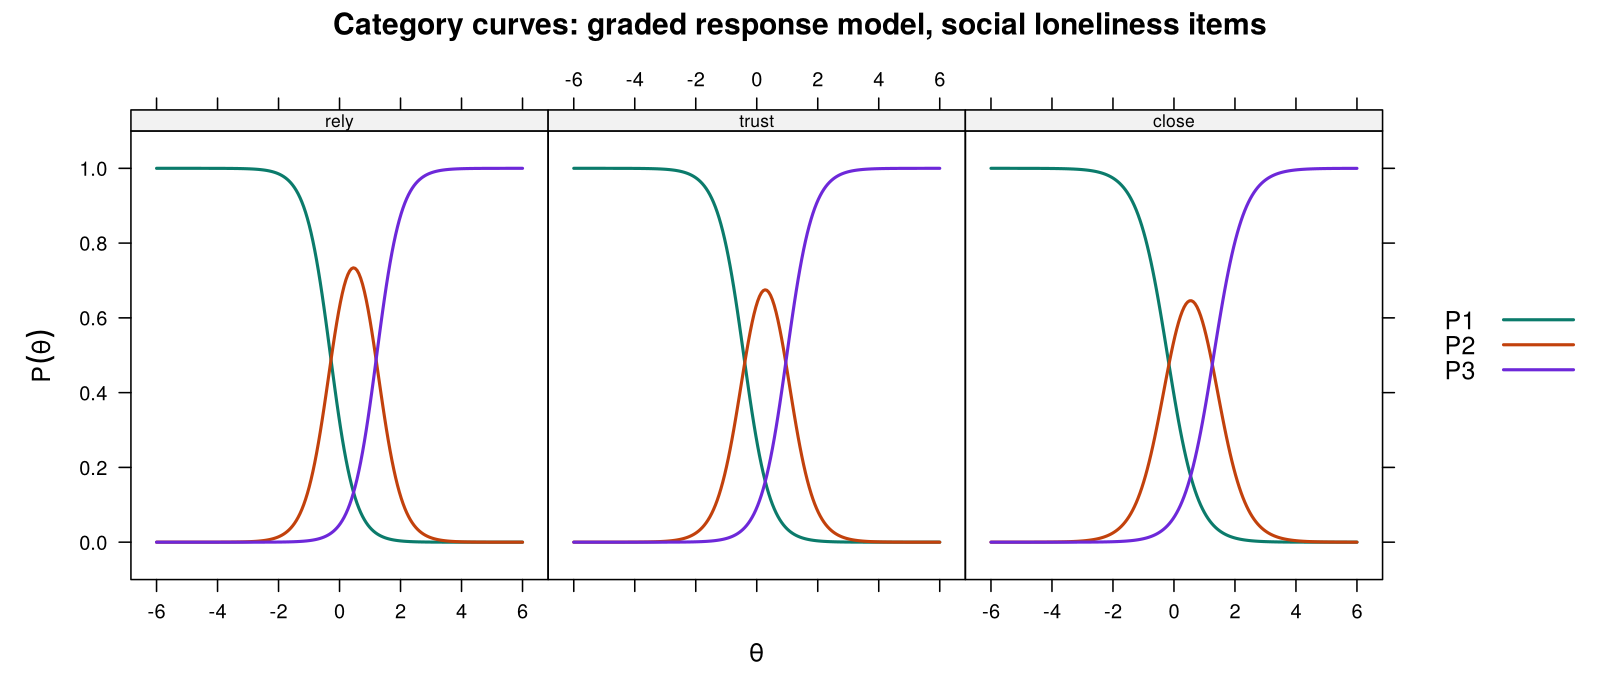
plot(grm, type = "trace")). P1 is the least lonely answer, P2 is "More or less" and P3 is the lonely answer.A question about how precisely a scale measures at a particular cut-point or trait level is therefore answered from the information or the standard error at that point, not from a single alpha. Item response theory and classical test theory differ in other ways too, and Table 7.4 compares them on six features, from the unit of analysis to the demands that each places on the analyst.
Table 7.4. Classical test theory and item response theory compared.
| Feature | Classical test theory | Item response theory |
|---|---|---|
| Unit of analysis | The total score | Each item and its curve |
| Precision | One reliability (alpha or omega) for everyone in the sample | Information and standard error that vary along the trait |
| Dependence on the sample | Item statistics and reliability depend on the sample's spread | Item parameters are, in principle, the same in any group in which the model holds |
| Scoring | Sum or mean of item codes | Estimated trait level (θ), which can be compared across different item sets |
| Typical uses | Reporting a scale in a manuscript; short established scales | Building and shortening scales, item banks, computer adaptive tests, testing item bias |
| Demands | Simple to compute and explain | Larger samples, model checks (unidimensionality, local independence) and specialist software |
The graded response model above was fitted to the three social items only, because IRT models of this kind assume that the items measure one trait (unidimensionality), and the factor analysis has shown that the six items measure two. For a manuscript that uses an established scale such as the De Jong Gierveld scale, classical reliability and a confirmatory factor analysis are usually sufficient. Item response theory becomes important when a scale is being built, shortened or compared across groups, and the PROMIS item banks used in health research are a prominent example of its use (Cella et al., 2010).
Worked code 7.1 shows how the graded response model for the three social items was fitted with the mirt package and how Figures 7.9 and 7.10 were drawn. It is optional and not assessed; open it if you would like to try the model yourself.
This box is optional and is not assessed. It shows how the item response curves in the reading were estimated, for anyone who would like to try. It continues from the Section 2 activity and uses the social_items data frame created there. It needs the mirt package, which may take a few minutes to install.
# OPTIONAL: install.packages("mirt")   # run once
library(mirt)
# A graded response model for the three social loneliness items
grm <- mirt(social_items, model = 1, itemtype = "graded", verbose = FALSE)
round(coef(grm, IRTpars = TRUE, simplify = TRUE)$items, 2)Each row is an item. The column a is the discrimination (2.47, 2.32 and 2.03, all steep). The columns b1 and b2 are the thresholds: the trait levels at which the probability of answering above the first and above the second category reaches 0.5. All three items have b1 near −0.2 to −0.4 and b2 near 1.0 to 1.3, so they measure the same part of the trait.
plot(grm, type = "trace")    # category curves for each item
plot(grm, type = "info")     # test information curve
These two lines produce no console output. They draw the category curves and the test information curve shown in Figures 7.10 and 7.9.
Item response theory has described each social item along a continuous trait. The lesson's objectives end here; the last part of the section introduces a related latent variable model for readers who want to go further.
Additional Context: Latent Class Analysis
This part is background enrichment rather than one of the lesson objectives, and it is not assessed. Factor analysis and item response theory assume that the latent variable is continuous: people differ by degree along a trait such as loneliness. Latent class analysis is the latent variable model for a categorical latent variable. It assumes that the sample is a mixture of a small number of hidden groups, called latent classes, and that each class has its own probability of each answer to each item (Lazarsfeld & Henry, 1968; Collins & Lanza, 2010). Within a class, the answers to different items are assumed to be unrelated (local independence), so the classes account for all of the association between the items. The model estimates the size of each class and, for every person, a set of class-membership probabilities: the probability of belonging to each class given that person's answers. People are usually placed in their most likely class, and the membership probabilities show how certain each placement is.
The number of classes is chosen by fitting models with one, two, three or more classes and comparing them. The BIC balances fit against the number of parameters, and lower values are preferred, although in large samples it often keeps falling as classes are added. Entropy summarizes how clearly people are assigned to classes, on a scale from 0 to 1, with values near 1 indicating well-separated classes. The size of each class and whether the classes make substantive sense also guide the choice. Factor analysis groups items that measure the same trait, whereas latent class analysis groups people who answer in similar ways. The card below links to an optional narrated walkthrough that fits latent class models to CSCS data in R.
Optional enrichment: Latent Class Analysis in R
The narrated walkthrough fits models with one to five classes to seven checkbox items from the Canadian Social Connection Survey on what people missed when they felt lonely, compares the models with the BIC, describes the three classes it keeps and assigns each person to a class. It goes beyond the knowledge checks of this lesson.
Open the Latent Class Analysis in R walkthroughThis section has used exploratory and confirmatory factor analysis to show that the six De Jong Gierveld items measure two related constructs, explained what that result means for how the scale is scored, and drafted the Measures paragraph that completes Amira's reply. It has also introduced item response theory, in which each item has a curve and precision varies along the trait. The key takeaways below draw the section together before its knowledge check, and the final assessment of the lesson brings the four sections together.
Key Takeaways
- 6.1 Factor analysis rests on the same reflective idea as alpha: the answer to each item is partly caused by a latent factor that the items share and partly unique to the item, and the unique part includes measurement error and anything specific to the item's wording. For a standardized item on a single factor, the loading (λ) is the correlation between the item and the factor, and squaring it gives the communality, the share of the item's variance that the factor explains; the rest, 1 − λ², is the unique variance. Squaring is the step that is most often forgotten: a loading of 0.70 sounds strong, yet the factor explains only about 49% of that item's variance, and for the weak item "I miss having people around me", with a loading of 0.20, it explains only 0.041, about 4%, the value that the R-Square section of the lavaan summary prints in Activity 7.4. In lavaan output you can read the unique variance directly from the
Std.allcolumn under Variances (0.959 formiss), so the share of each item's variance that the factor explains can be read from R rather than worked out by hand. - 6.2 Exploratory and confirmatory factor analysis do different jobs. Exploratory factor analysis lets every item load on every factor and suggests how many factors there are and which items belong together, whereas confirmatory factor analysis tests a structure stated in advance, with each item loading only on its assigned factor, and because the data can reject it, it is the stronger test of a published scale. Exploratory factor analysis suggests a structure, and confirmatory factor analysis tests it in data the exploration did not use, so the sample is split at random: explore in one half, confirm in the other. The one-line reason an exam answer needs is that confirming in the same data would simply reward whatever the exploration happened to find. In R, calling
set.seed()beforesample()makes the split the same every time the code is run, so the results can be reproduced. - 6.3 An exploratory factor analysis is easiest to read as four steps, and exam questions usually follow the same order. First, check that the items are suitable: an overall KMO of about 0.6 or more (0.68 in the exploratory half) and a significant Bartlett's test, which with large samples is only a minimal check. Second, choose the number of factors with parallel analysis, which keeps the factors whose eigenvalues exceed those from random data of the same size;
fa.parallel()prints the answer, and it is more trustworthy than the old rule of keeping every eigenvalue above 1, which often keeps too many factors. Third, use an oblique rotation such as oblimin, because related constructs such as emotional and social loneliness are expected to correlate (0.29 here), and an oblique rotation gives nearly the same answer as an orthogonal one if they turn out not to. Fourth, read the loading matrix: name each factor from the content of the items that load on it (labels such as MR1 and MR2 only number the factors), and flag any item that loads weakly everywhere, asmissdoes, or loads on two factors, then review its wording and check it in the confirmatory half rather than dropping it automatically. - 6.4 To judge a confirmatory model in lavaan, start with the chi-square test but do not stop there: with large samples it rejects almost every model, including models with trivial misfit, so it is reported but rarely decisive. Then compare the four fit indices with their guides: the CFI and TLI should be 0.95 or higher, the RMSEA 0.06 or lower (up to 0.08 is often called acceptable) and the SRMR 0.08 or lower, and a value close to a guide is better called borderline than a pass or a fail, as for the two-factor model here (CFI 0.949, TLI 0.905, RMSEA 0.082, SRMR 0.060). Next, read the
Std.allcolumn under Latent Variables item by item, because good overall fit does not mean that every item is good: the weakest item is the one with the smallest standardized loading, and the 1.000 in the Estimate column for the first item of each factor is fixed by lavaan to set the scale, not a sign of a strong item. Finally, compare one-factor and two-factor models withanova(): a large, significant chi-square difference and lower AIC and BIC (lower is better) all favour the two-factor model, as they do here (chi-square difference 386.95 on 1 degree of freedom; AIC 20,825 against 21,210). - 6.5 Structural results matter because they decide how the scale is scored. When two factors fit well and clearly better than one, the scale is scored and reported as two subscales, with or without the total, rather than as a single score; for the De Jong Gierveld items, two related factors fit far better than one, so Amira reports the subscales separately as well as the total and notes that the weak item and the direction of wording (a method effect) may explain part of the misfit. A Measures paragraph then brings the whole lesson together, roughly in this order: name the scale and its source, describe the items and response options with an example, state the scoring rule (including reverse-coding and any cut-point), say how missing items were handled, report alpha and omega in the study sample, and summarize the structural and other validity evidence. Finish by stating what the evidence supports, for which use and in which population, instead of calling the scale "validated", and use Worked Example 7.2 as your model.
- 7.1 Item response theory looks at the items one at a time, describing each with an item characteristic curve: the probability of the keyed answer (here, the lonely answer) at each level of the latent trait θ, which is scaled so that 0 is the average. In the two-parameter model, the difficulty b is the trait level at which that probability is 0.5, so an item with a high b is endorsed only by people high on the trait, and the discrimination a is the steepness of the curve at that point, so an item with a high a separates people just below b from people just above it sharply. Two quick checks help with exam questions: if b is below 0, a person of average trait level (θ = 0) has a probability above 0.5 of giving the keyed answer, and of two items, the one with the larger a has the steeper curve. The Rasch model gives every item the same discrimination, the two-parameter model lets discrimination vary between items, and the graded response model extends the two-parameter model to ordered answers such as "No", "More or less" and "Yes", with one threshold for each boundary between adjacent categories.
- 7.2 The most practical difference between the two frameworks is how they describe precision. Classical test theory gives one reliability, such as alpha or omega, for everyone in the sample, whereas item response theory gives precision that varies along the trait: each item's information peaks at its difficulty, the items' information adds up to the test information, and the standard error of a person's estimated trait is 1 / √(test information), so it is small where the items measure well and large where they do not. For the three social items, test information is high between a θ of about −1 and 2 (a peak of about 4 gives a standard error of about 0.5) and falls toward zero at the extremes, so the items distinguish poorly among people who are very connected or very isolated. When a question asks how precisely a scale measures at a particular cut-point or trait level, look at the information or the standard error at that point rather than at a single alpha.
1. In a standardized factor solution, item X has a loading of 0.30 on its factor and item Y has a loading of 0.80 on the same factor. An analyst squares the two loadings in R. Which statement is correct?
> round(c(X = 0.30, Y = 0.80)^2, 2)
   X    Y
0.09 0.64
2. A team has 1,000 responses to a new ten-item scale and splits them at random into two halves of 500. In the first half the KMO is 0.81, and parallel analysis gives the eigenvalues below. What should the team conclude and do next?
| Factor | Eigenvalue from the data | Eigenvalue from random data |
|---|---|---|
| 1 | 2.90 | 1.25 |
| 2 | 1.30 | 1.15 |
| 3 | 1.05 | 1.08 |
| 4 | 0.60 | 1.02 |
3. A two-factor and a one-factor confirmatory model of a nine-item scale are fitted in the confirmatory half of a sample (900 people). The results are summarized below. Which conclusion is best?
| Result | Two-factor model | One-factor model |
|---|---|---|
| Chi-square (df), p | 58.4 (26), p < 0.001 | 368.4 (27), p < 0.001 |
| CFI | 0.98 | 0.81 |
| TLI | 0.97 | 0.75 |
| RMSEA | 0.037 | 0.119 |
| SRMR | 0.035 | 0.090 |
| AIC | 21,400 | 21,708 |
| Chi-square difference test | 310.0 on 1 df, p < 0.001 | |
4. Three items of a hearing difficulty scale, each scored 1 for "yes" and 0 for "no", are described by a two-parameter logistic (2PL) model in which the trait θ (hearing difficulty) has mean 0 and standard deviation 1. Which statement is correct?
| Item | Discrimination a | Difficulty b |
|---|---|---|
| A: "I have trouble following a conversation in a noisy room" | 2.4 | −0.5 |
| B: "I turn the television up louder than other people like" | 0.7 | 0.3 |
| C: "I cannot hear the telephone ring in the next room" | 1.5 | 2.2 |
5. A depression scale has an alpha of 0.85. An item response model of the same items gives a standard error of the estimated trait of 0.40 at θ = 0 and 1.20 at θ = 2.5. A colleague says: "Alpha is 0.85, so every participant's score is measured with the same precision." Which response is best?
6. A published seven-item Screening Barriers Scale has four practical items (B1 to B4; B4 reads "I do not know how to book a screening test") and three emotional items (B5 to B7). In the confirmatory half of the sample (700 adults), the two-factor model fits well (CFI = 0.983, TLI = 0.972, RMSEA = 0.053, SRMR = 0.031) and far better than a one-factor model (CFI = 0.730, RMSEA = 0.202). Part of the lavaan output for the two-factor model is shown below, followed by one line of R that squares B4's standardized loading. Which statement is correct?
Latent Variables:
                   Estimate  Std.Err  Std.all
  practical =~
    B1                1.000              0.78
    B2                0.962    0.046     0.74
    B3                0.915    0.045     0.71
    B4                0.441    0.044     0.36
  emotional =~
    B5                1.000              0.81
    B6                0.948    0.043     0.77
    B7                0.851    0.042     0.69

> round(0.36^2, 2)
[1] 0.13
Std.all column item by item: B4 has a standardized loading of 0.36, against 0.69 to 0.81 for the other items, and the R line shows that its factor explains only 0.13 (about 13%) of its variance. Fit indices ask whether the model reproduces the pattern of correlations among the items, and an item that correlates weakly with the others is reproduced well by a small loading, so a model can fit well while one item measures its factor poorly (option a). In a published scale a weak item is kept, reported and its wording reviewed rather than dropped automatically (option c). Option b is the tempting error: lavaan fixes the first loading of each factor at 1.000 to give the factor a scale, and B1 and B5 have the largest standardized loadings. Because two factors fit well and far better than one, the scale is scored and reported as two subscales. (Section 4, 6.1 The Common Factor Model, 6.4.3 Comparing Models and Reading Each Item, 6.5 What the Structure Means for Scoring and Reporting, and Activity 7.4; Objectives 6.1, 6.4 and 6.5)Lesson 7: Final Assessment
Bringing It All Together
This lesson took the analyst's view of the multi-item scales that most analyses of the CSCS use. Section 1 traced the chain from a construct, through its domains and items, to an instrument and a scoring rule. It separated reflective scales, whose items are caused by the construct and are expected to correlate, from formative indices, whose components define the construct. It prepared and scored the six De Jong Gierveld items in R, including the reversal of the three positively worded items, and introduced classical test theory, in which reliability is the true-score share of observed variance and measurement error weakens correlations.
Section 2 estimated reliability. A single survey supports only internal consistency, and in the CSCS the social subscale had an alpha and an omega of 0.75 while the emotional subscale had an alpha of 0.51 and an omega of 0.57, with one weak item. Alpha rises with the number of items, assumes equal loadings, cannot show that a scale is unidimensional and has no meaning for an index, and it fell from 0.59 to 0.42 when the reversal step was skipped. Section 3 treated validity as an argument for a stated use in a stated population, organized the evidence with the COSMIN taxonomy, and found convergent, discriminant and known-groups evidence that supports the scale and distinguishes its two subscales. Section 4 used exploratory factor analysis in one half of the sample and confirmatory factor analysis in the other to show that two related factors (CFI 0.949, RMSEA 0.082) fit far better than one (CFI 0.739, RMSEA 0.177), and it introduced item response theory, in which each item has a curve and precision varies along the trait.
Together these steps answered both of the reviewer's questions and produced a Measures paragraph that reports the scale's source, scoring, reliability in the study sample and structural evidence. The final assessment asks for these steps to be applied to new scales.
Key Takeaways from this lesson
- You can now trace any score back to its construct, through its domains, items, instrument and scoring rule, and tell a reflective scale from a formative index by asking which way the arrows run. The items of a reflective scale are expected to correlate, whereas the components of a formative index need not, so internal consistency applies only to scales. On the exam, if having one component does not make another more likely, treat the measure as an index and say that alpha does not apply to it.
- You can explain how item answers become scores, and check that each step worked. Reverse-worded items must be recoded according to the scoring manual before items are combined. A missed reversal shows up as psych's warning, a negative
r.dropand a lower alpha, and the fix is to recode from the manual with (maximum + minimum) minus the original code, not to drop the item or letcheck.keys = TRUEdecide. Remember, too, that a published cut-point gives an easily reported category at the cost of discarding information. - You can say what a reliability value means, what random error does to associations, and which kind of reliability a study design can estimate. A reliability of 0.80 means that 80% of the variance in observed scores is true-score variance, unreliable measures make observed correlations weaker than the true ones, and a single survey supports only internal consistency. When you are given an intraclass correlation, read it with Koo and Li's bands and note that a shift between occasions lowers it; when you are given a kappa, remember that it removes chance agreement and is pulled down by a rare category.
- You can read
alpha()and omega output and judge it against a stated use. Cronbach's alpha rises with the number of items, assumes equal loadings and cannot show unidimensionality, so McDonald's omega is reported alongside it. As a working rule, about 0.70 suffices in early research, about 0.80 for basic research comparing groups and 0.90 or more for decisions about individuals, and a weak item in a published scale is kept, reported and tested with a sensitivity analysis rather than dropped after looking at the data. - You can explain why a reliable score is not necessarily valid, and build a validity argument from the right kinds of evidence. Validity is an argument for a stated use in a stated population, built from content, criterion, construct and structural evidence. In practice, name the kind of evidence each result provides, compare a difference with the minimal important difference before calling it important, remember that group comparisons assume measurement invariance, and never describe a scale simply as "validated".
- You can read exploratory and confirmatory factor analyses and say what they mean for how a scale is scored. Exploratory factor analysis suggests a structure, and confirmatory factor analysis tests it in data the exploration did not use, judged with the CFI, TLI, RMSEA and SRMR. Report the chi-square test but do not let it decide in a large sample, read the standardized loadings item by item, and when two factors fit far better than one, score and report the scale as two subscales.
- You can explain item difficulty, item discrimination, item characteristic curves and test information in plain words. Item response theory describes each item with a curve defined by its difficulty and discrimination, and gives precision that varies along the trait. Classical test theory, by contrast, gives one reliability for everyone in the sample, so the most useful reminder is this: difficulty b is where the curve crosses a probability of 0.5, discrimination a is how steep it is there, and the standard error is small only where test information is high.
The final assessment covers all four sections. All 16 questions must be answered correctly (100%) to finish the lesson.
Final Knowledge Assessment
1. A survey contains the four measures below. For which one is it appropriate to report Cronbach's alpha?
2. A five-item medication worry scale is answered from 1 to 5. Four items are worded so that agreement means more worry; item W3, "I feel confident about my medicines", is worded the other way. Part of the alpha() output for the items as stored is shown below. What does it show?
 raw_alpha
      0.21

 Item statistics
   r.drop
W1   0.36
W2   0.35
W3  -0.51
W4   0.35
W5   0.20
r.drop, the correlation of the item with the sum of the other items. A negative value means that people who score high on the other items score low on W3, which is what happens when an oppositely worded item is added without reverse-coding, and it also pulls alpha down (to 0.21). W5 has a low but positive value, which marks a weak but correctly coded item, so option b is wrong. Option c treats a coding error as a bad item; the remedy is to recode W3 as 6 minus its code and recompute alpha. (Section 2, 2.3 Spotting a Missed Reversal: The Scoring Manual Decides, and Activity 7.2; Objective 2.3)3. In a study of social support and wellbeing, the correlation between people's true levels of the two constructs is 0.50. The social support score has a reliability of 0.81 and the wellbeing score has a reliability of 0.49. An analyst applies Spearman's attenuation formula in R. Which interpretation is correct?
> 0.50 * sqrt(0.81 * 0.49)
[1] 0.315
4. An online survey gives a depression scale once to 3,000 adults. In a sub-study, two interviewers independently classify the same 120 participants as having probable depression or not. They agree on 90% of participants. Each interviewer classifies about 1 participant in 10 as "yes", so the agreement expected by chance is 82%, and Cohen's kappa is 0.44. Which statement is correct?
5. An eight-item scale has an alpha of 0.86, and a parallel analysis of the same items suggests two factors. A colleague says that these two results contradict each other. Which response is best?
check.keys only reverses items. (Section 2, 4.2 What Alpha Assumes and What It Cannot Show, the accordion panel "A high alpha shows that the scale measures one construct" and its callout; Objective 4.2)6. A six-item work stress scale is answered from 1 (never) to 5 (always), and its alpha is 0.75. Part of the alpha() output is shown below, including the response frequencies for item S6, "I have taken sick leave because of stress". How is S6 best described?
 Reliability if an item is dropped:
   raw_alpha
S6      0.79

 Item statistics
   r.drop
S1   0.59
S2   0.57
S3   0.56
S4   0.54
S5   0.53
S6   0.20

 Non missing response frequency for each item
       1    2    3    4    5
S6  0.68 0.22 0.07 0.03 0.00
r.drop (0.20, against 0.53 to 0.59), alpha would rise from 0.75 to 0.79 without it, and 68% of people answer "never". When most people give the lowest answer the item has a floor effect, so it tells apart only the few people with high stress and relates only loosely to the other items. Option a is the tempting error: an unreversed item has a negative r.drop, not a low positive one, and option b names the wrong end (a ceiling effect is a pile-up at the top answer). In a published scale the item would be kept, reported and tested with a sensitivity analysis rather than dropped. (Section 2, 4.1 Cronbach's Alpha and the Item Statistics, and 4.3 McDonald's Omega and What to Do About a Weak Item, the running case card; Objectives 4.1 and 4.3)7. A six-item fatigue subscale has an alpha of 0.84 (omega 0.85), and a three-item sleep subscale has an alpha of 0.72 (omega 0.76). A clinic wants to use the subscales both to compare groups of patients in a research report and to decide which individual patients are referred to a fatigue clinic. Which statement is correct?
8. A report states: "The Food Security Worry Scale is a validated and reliable measure (alpha = 0.86)." Which revision best reflects the lesson's view of validity?
9. A pain interference scale is scored 0 to 50. Half its standard deviation is 3.5 points and its standard error of measurement is 3.1 points, and patients who said at follow-up that their pain was "a little better" had improved by 4.0 points on average. Patients at one clinic score 2.0 points lower on average than patients at another clinic (p = 0.01). Which statement is correct?
10. Before analyzing a new caregiver burden score, a team predicted that it would correlate strongly with an established caregiver burden scale and less strongly with depressive symptoms, and that caregivers of people with dementia would score higher than caregivers of people with arthritis. The score correlates 0.68 with the established scale and 0.35 with depressive symptoms, and the mean scores are 34 for dementia caregivers and 26 for arthritis caregivers. Which interpretation is best?
11. An eight-item barriers-to-healthy-eating scale has four items about time (T1 to T4, for example "I don't have time to cook") and four about cost (B1 to B4, for example "Healthy food costs too much"); item T4 reads "I can't afford the time to plan healthy meals". An exploratory factor analysis with oblimin rotation in the exploratory half of a sample gives the loadings below (loadings under 0.3 are hidden). Which reading is correct?
Loadings:
     MR1    MR2
T1  0.78
T2  0.72
T3  0.69
T4  0.41   0.38
B1         0.80
B2         0.75
B3         0.66
B4         0.58
12. Before an exploratory factor analysis of ten items written to measure two related constructs, worry about health care and avoidance of health care, the output shows an overall MSA (KMO) of 0.86 and a Bartlett test with p < 0.001. The analyst plans an oblimin rotation. Which statement is correct?
13. A two-factor confirmatory model of ten items fitted to 1,500 people gives a chi-square of 402 on 34 degrees of freedom (p < 0.001), CFI = 0.93, TLI = 0.91, RMSEA = 0.085 and SRMR = 0.065. Using the guides taught in the lesson, how is its fit best described?
14. A two-factor confirmatory model fits well (CFI = 0.98, RMSEA = 0.04). Part of the lavaan output for the first factor is shown below (=~ is read as "is measured by"), followed by a line of R that squares the standardized loadings. A colleague concludes that "because the model fits well, every item measures its factor well." Which response is best?
Latent Variables:
             Estimate  Std.Err  Std.all
  support =~
    A1          1.000              0.78
    A2          0.950    0.052     0.74
    A3          0.310    0.048     0.26
    A4          0.902    0.050     0.71

> round(c(A1 = 0.78, A2 = 0.74, A3 = 0.26, A4 = 0.71)^2, 2)
  A1   A2   A3   A4
0.61 0.55 0.07 0.50
Std.all column are the values to compare, and the share of an item's variance explained by its factor is the squared loading, which the R line prints: 0.07 (about 7%) for A3, against 0.50 to 0.61 for the other items. Fit indices ask whether the model reproduces the pattern of correlations, and an item that correlates weakly with everything is reproduced well by a small loading, so good fit does not mean that every item is good. Option c is the tempting error: lavaan fixes the first loading of each factor at 1.000 to give the factor a scale, so that Estimate is not comparable with the others, and A1's standardized loading (0.78) is in fact the highest. (Section 4, 6.4.1 Writing the Model in lavaan and 6.4.3 Comparing Models and Reading Each Item; Objective 6.4)15. A ten-item depression screener has an alpha of 0.85. An item response model of its items shows test information that peaks at about 11 near θ = 1.5, where the screener's cut-point lies, and falls to about 1 at θ = −1. The analyst converts the two information values to standard errors in R. Which statement is correct?
> 1 / sqrt(c(11, 1))
[1] 0.3015113 1.0000000
16. A survey of 2,000 young adults, completed once online, uses the published eight-item Climate Distress Scale, which has a worry subscale and a helplessness subscale. Before the analysis, the team predicted that the total score would correlate strongly with a question on worry about climate change, less strongly with general anxiety, and be higher among people evacuated by a wildfire. The results are summarized below. Which sentence for the Measures paragraph reports them best?
Confirmatory models, random half (n = 1,000)
              CFI   TLI RMSEA  SRMR
Two factors 0.971 0.957 0.055 0.033
One factor  0.867 0.813 0.115 0.064
Chi-square difference test: p < 0.001
Factor correlation: 0.68

Correlations with the total score
  Worry about climate change    0.61
  General anxiety score         0.24

Mean total score
  Evacuated by a wildfire       19.8
  Not evacuated                 15.1
✦ Before submitting: pass every section knowledge check (100%).