Modelling Dependent Data
Exploratory Data Analysis For Epidemiology
Learning objectives for this lesson:
- Identify clustered and repeated-measures data from the study design, name the variable that defines the clusters, and explain why the output of an ordinary regression gives no warning of clustering.
- Explain why ignoring clustering makes standard errors, confidence intervals and p-values too small, and distinguish cluster-level from person-level predictors to say which results are affected most.
- Interpret the intracluster correlation coefficient (ICC), the design effect and the effective sample size from R output, and explain why a clustered study gains more from extra clusters than from extra people per cluster.
- Interpret a linear mixed model with a random intercept fitted with
lmer(): its fixed effects, its cluster and residual variances, the adjusted ICC and the estimated shift of a single cluster, compared with an ordinary regression. - Describe the checks of a linear mixed model (residual plots, a Q-Q plot of the cluster effects, the number of clusters and a test for a singular fit), and explain what a random slope adds and what a singular-fit or convergence warning means.
- Interpret odds ratios from a logistic mixed model (GLMM,
glmer()) and from GEE (geeglm()), distinguish cluster-specific from population-averaged odds ratios, and choose between the two methods from the research question and the number of clusters. - Interpret a repeated-measures analysis in long format, including the group-by-time interaction in a mixed model or a GEE model, and explain how missed visits affect a complete-case analysis, a mixed model and GEE.
This course was developed by Dr. Kiffer G. Card based on Dohoo, I. R., Martin, S. W., & Stryhn, H. (2012). Methods in Epidemiologic Research. VER Inc.
Glossary: Key Terms, People & Concepts
📚 Reference page, available throughout the lesson
This glossary collects the key concepts, methods and people in this lesson. It can be used as a reference while working through the material or as a review before assessments. Typing in the search box filters the entries.
lmer() for a continuous outcome and glmer() for a binary outcome.
ranef() prints the estimated shift for each cluster.
lmer() and glmer() it is written (1 | cluster).
(1 + time | cluster), which is the same as (time | cluster), and needs more data than a random intercept, so it often fails to converge in small studies.
Random effects in the model summary and by VarCorr().
lmer() from the lme4 package, and loading lmerTest adds p-values for the fixed effects.
isSingular() returns TRUE. It usually means the random-effects part is more complex than the data can support.
glmer(), and its exponentiated fixed effects are cluster-specific odds ratios.
geeglm() from the geepack package, and its odds ratios are population-averaged.
arm:visit, which R includes together with arm and visit when the formula contains arm * visit. It tests whether the outcome changes at a different rate in two groups. In a trial with repeated measures it usually answers the main question.
Recognising Dependent Data
966 patients in 30 clinics
Three levels of clustering
The same difference, with and without allowing for clinics
Overview
Ordinary linear and logistic regression models assume that the observations are independent, so that one person's outcome carries no information about another person's outcome. This lesson deals with data in which that assumption fails, because observations share something, such as patients attending the same clinic or the same person measured at several visits. This section shows how to recognise such dependent data from the design of a study, why ignoring the dependence makes a regression model too confident, why the problem is largest for predictors measured on the cluster, and how the intracluster correlation coefficient (ICC), the design effect and the effective sample size measure the strength of the dependence. The later sections fit models that allow for it.
Learning Objectives
- 1.1 Identify clustered data and repeated measures from the study design, name the variable that defines the clusters, and explain why ordinary regression output gives no warning of clustering.
- 2.1 Explain why ignoring dependence makes standard errors, confidence intervals and p-values too small.
- 2.2 Distinguish cluster-level from person-level predictors and explain why cluster-level predictors are affected most.
- 2.3 Compare an ordinary regression with a mixed model and describe how the standard error changes.
- 3.1 Interpret the intracluster correlation coefficient (ICC), the design effect and the effective sample size from R output, and explain why extra clusters add more precision than extra people per cluster.
1.1 Recognising Dependent Data
Data are dependent when observations can be grouped into clusters whose members are more alike than members of different clusters. By this we mean that once you know the outcome of one member of a cluster, you can make a slightly better guess about the outcome of another member of the same cluster, because the two share something that affects the outcome. For example, if one patient at a clinic has high blood pressure, another patient at that clinic is a little more likely than a patient elsewhere to have high blood pressure too, perhaps because the clinic serves an older population or its doctors manage hypertension in a particular way. Two forms of dependence are common in public health. In clustered data, people are grouped inside larger units: patients in clinics, students in schools, residents in neighbourhoods, or workers in workplaces. People in the same cluster share a setting, staff, policies and local conditions, so their outcomes tend to be similar. In repeated measures (also called longitudinal data), the same person is measured more than once, and each person's measurements form a cluster. Clusters can also be nested inside one another, such as patients within doctors within clinics, which this lesson mentions only briefly. Independence, by contrast, is a reasonable assumption when each person was sampled once and separately, as in a random sample drawn from a population register.
Table 5.1 gives four examples of studies that produce dependent data, with the cluster, the observation and the reason why observations in the same cluster are alike. In each case the cluster is the unit whose members tend to be alike: the clinic, the school, the household, or the person in a repeated-measures study, not the visit.
Table 5.1. Examples of clustered data and repeated measures in public health studies.
| Study | Cluster | Observation | Why observations in a cluster are alike |
|---|---|---|---|
| A survey of patients at 30 clinics | Clinic | Patient | Patients share doctors, practices and a local population. |
| A school-based physical activity program | School | Student | Students share teachers, facilities and a neighbourhood. |
| A household survey of food security | Household | Household member | Members share income, meals and housing. |
| A trial with visits at 0, 6, 12 and 18 months | Person | Visit | Each person brings their own genes, habits and baseline health to every visit. |
Three terms recur throughout the lesson. Click each of the cards below to review what a cluster is, what independence means and how it is judged, and what the effective sample size measures; the effective sample size is calculated for the clinic data later in this section.
Dependence is a property of the design, and it has to be recognised from how the data were collected. The caution below states the reason, and it is one of the most common errors in practice.
Clustering Cannot Be Seen in the Regression Output
Nothing in the output of lm() or glm() warns that the observations are clustered. Dependence has to be recognised from the study design and from a variable that identifies the clusters, which is why the first step in any analysis is to ask how the data were collected.
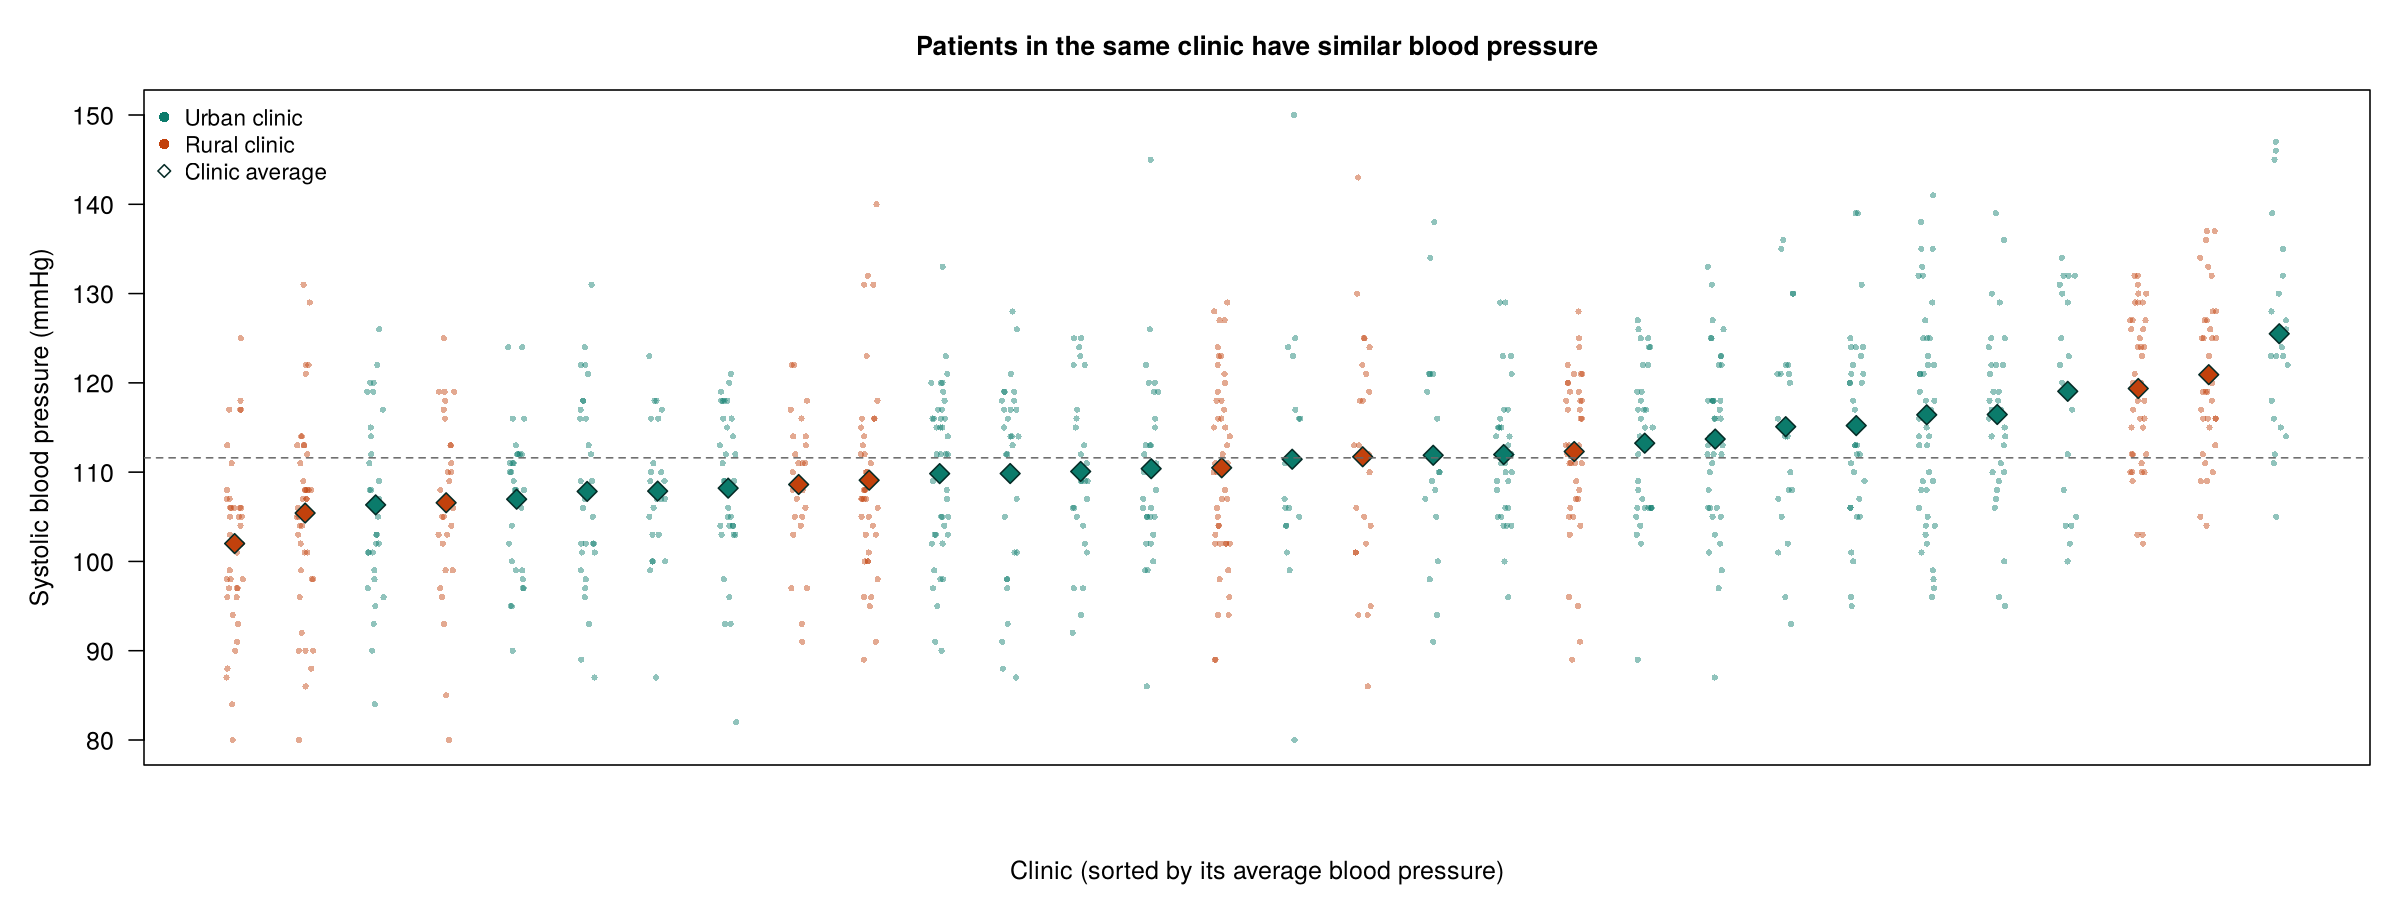
The first three sections of this lesson use phaa_clinics.csv, a simulated dataset of 966 patients attending 30 primary care clinics, with between 18 and 45 patients per clinic (32.2 on average). The patients were sampled through their clinics, so the clinic is the cluster and clinic_id is the variable that identifies it. The file records each patient's age, gender (female = 1 for women), smoking status, BMI, systolic blood pressure (sbp) and whether they were referred to a specialist (referred = 1). Two variables describe the clinic itself: clinic_urban (20 urban and 10 rural clinics) and clinic_size. Figure 5.1 plots the systolic blood pressure of every patient by clinic, so that the differences between clinic averages can be seen before any model is fitted.
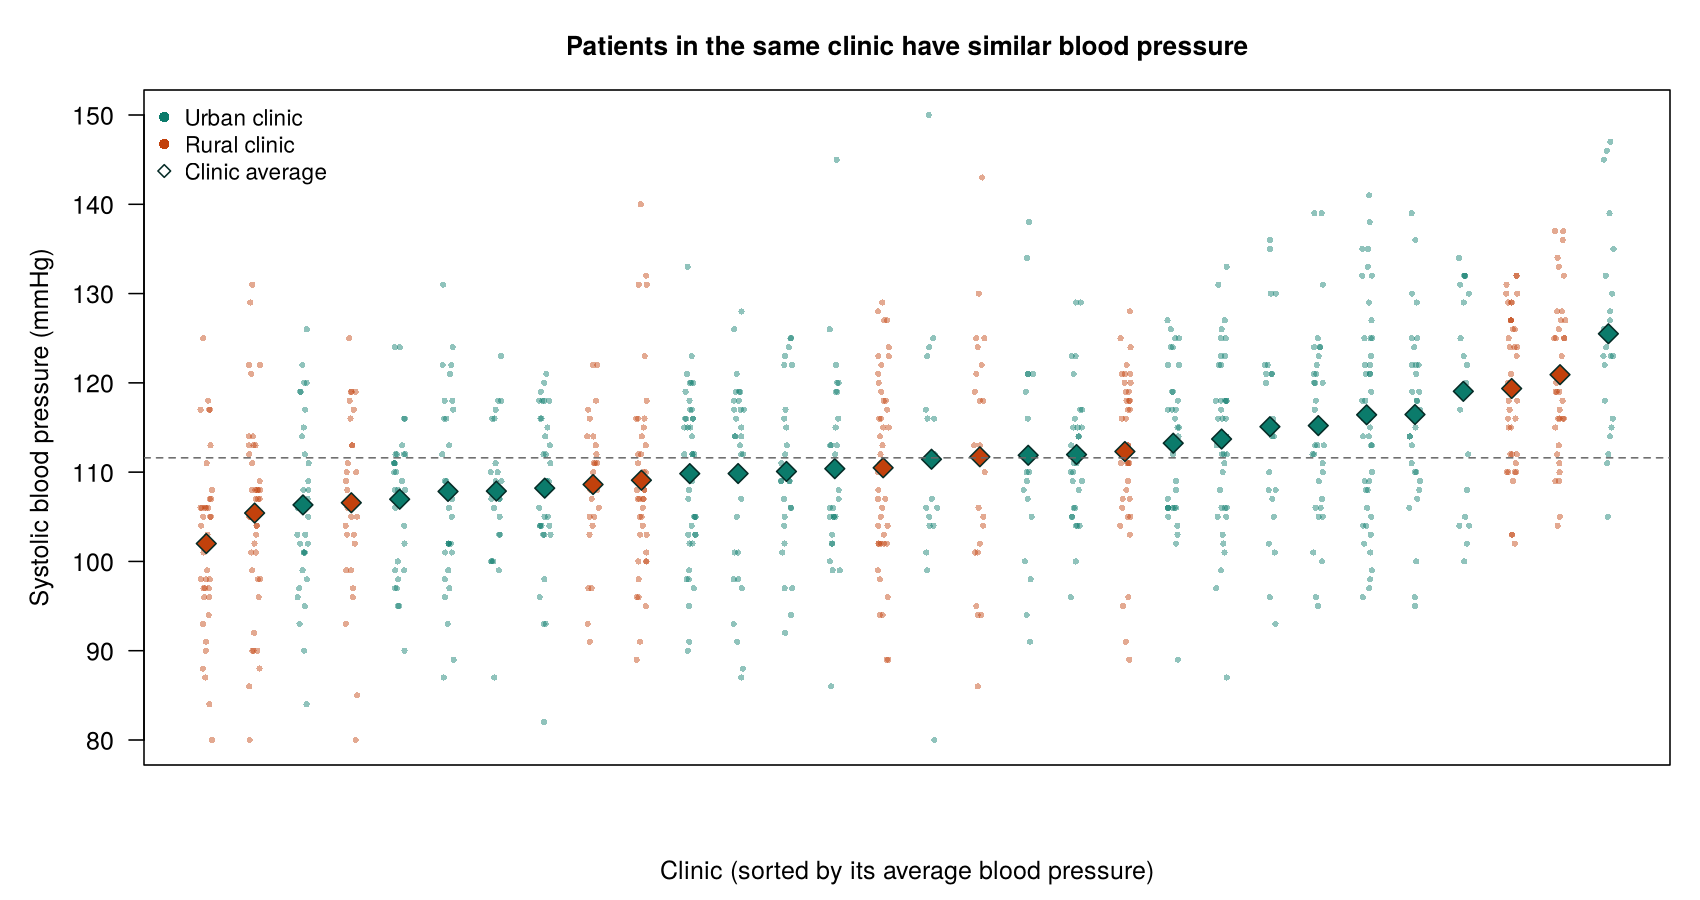
Figure 5.1 shows that a patient’s blood pressure depends partly on the clinic the patient attends, which is exactly the kind of dependence that the design of the study leads us to expect. The next question is what this dependence does to a regression model that ignores it.
2.1 Why Ignoring Dependence Makes Results Look Too Precise
A regression model that assumes independence treats every observation as a separate piece of information. By this we mean that each additional person is assumed to tell the model something new about the outcome, so that 966 patients are treated as 966 distinct pieces of evidence. When observations in a cluster are alike, however, part of what each one says has already been said by the others. For example, once the model has seen ten patients from a clinic whose patients tend to have high blood pressure, an eleventh patient from the same clinic mostly confirms what the first ten already showed about that clinic, rather than adding fully new evidence. As a result, the model overstates how much information it has. Because standard errors are calculated from the amount of information the model believes it has, they come out too small, which in turn makes the confidence intervals too narrow and the p-values too small. The point estimates themselves are often similar to those from a model that allows for clustering; it is the stated certainty around them that is wrong. In practice, this means that an analysis that ignores clustering can report a statistically significant association that the data do not support (Dohoo, Martin & Stryhn, 2012). The problem is therefore one of overconfidence about precision rather than a wrong estimate, and it does not affect every predictor equally, as the next part explains.
2.2 Cluster-Level and Person-Level Predictors
A cluster-level predictor takes one value for everyone in a cluster. Whether a clinic is urban (clinic_urban) is an example: every patient at an urban clinic has the value urban, and every patient at a rural clinic has the value rural. Although the dataset contains 966 rows, the 966 patients therefore supply only 30 independent values of this predictor, one for each clinic. Any comparison of urban with rural is, in effect, a comparison of 20 clinics with 10 clinics, and because the clinics differ from one another for many other reasons, that comparison is far less certain than a comparison of 966 independent people would be. This is why the standard error of a cluster-level predictor is the one most understated when clustering is ignored.
A person-level predictor, by contrast, varies among patients within each clinic. Smoking is an example, because a single clinic has both smokers and non-smokers. This allows the model to compare smokers with non-smokers who attend the same clinic, and in such a comparison the clinic's own baseline is shared by both groups and largely drops out. As a result, the standard error of a person-level predictor changes little when clustering is taken into account (in the Section 2 model, which adds age, gender and smoking, it falls from 0.79 to 0.70, and Section 3 shows a similar pattern for referrals). In fact, as that example shows, allowing for clustering can even make the estimate of a person-level predictor more precise, because once the differences between clinics are set aside, the remaining variation within clinics is smaller and the comparison of people within the same clinic is sharper. A quick test of the level of a predictor is to ask whether two people in the same cluster could have different values of it; if they cannot, the predictor is cluster-level. The comparison that follows shows how large the difference between the two kinds of predictor can be.
2.3 Comparing an Ordinary Regression with a Mixed Model
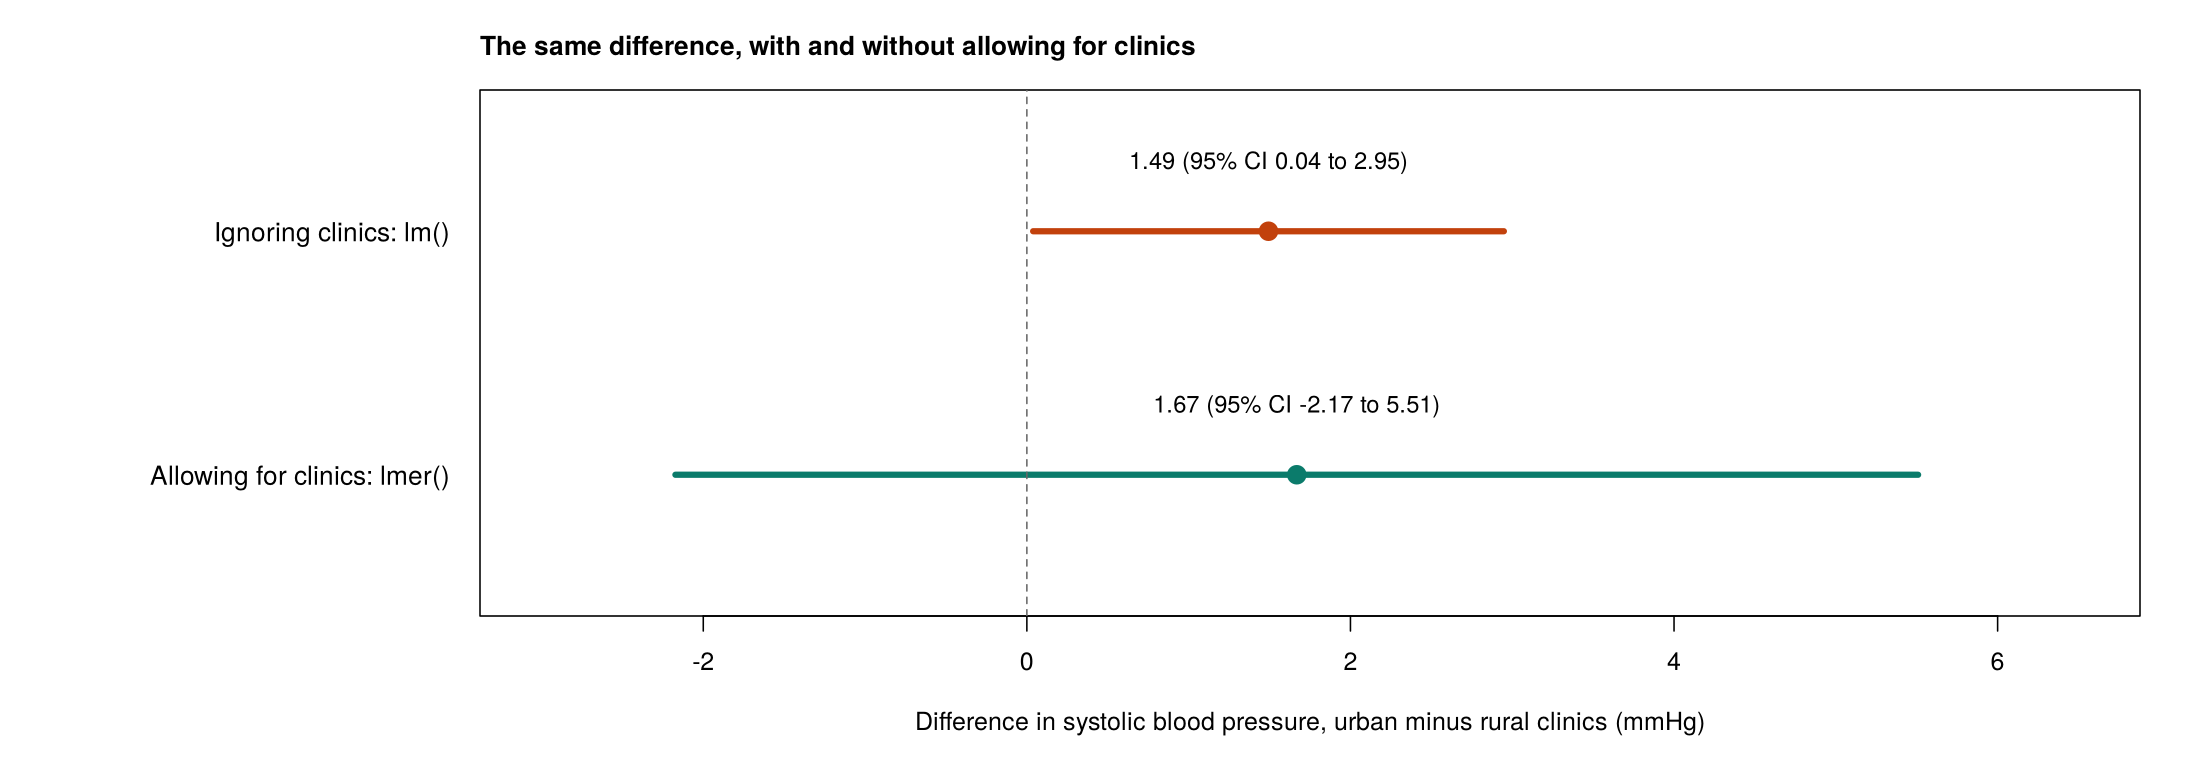
The question of whether patients in urban clinics have higher blood pressure than patients in rural clinics shows the problem directly, because urban clinic is a cluster-level predictor. An ordinary linear regression with lm() treats the 966 patients as independent. A linear mixed model with lmer() gives each clinic its own baseline, as Section 2 explains. Figure 5.2 compares the two estimates of the urban minus rural difference with their 95% confidence intervals, and Table 5.2 gives the estimates, standard errors and p-values from the two models.
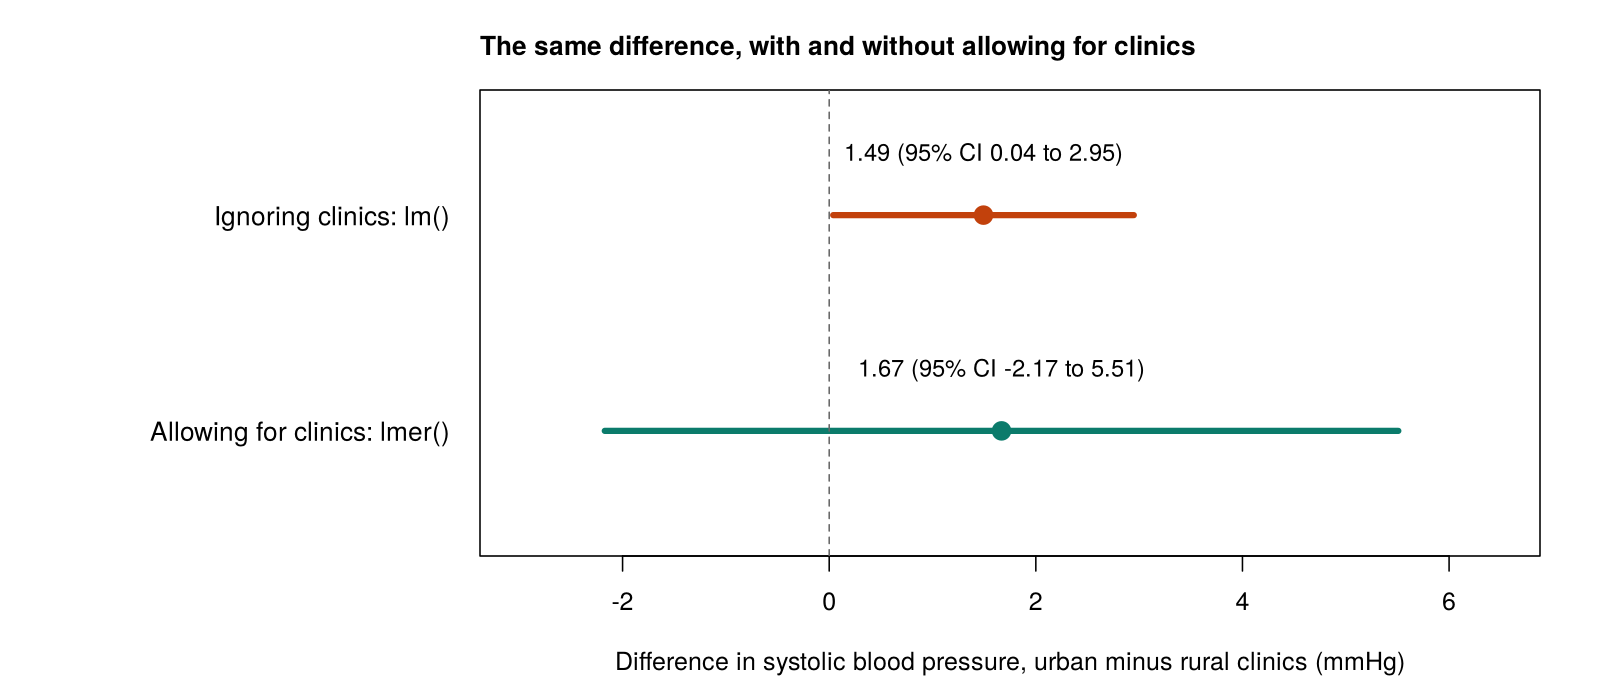
Table 5.2. The urban minus rural difference in systolic blood pressure from an ordinary regression and a linear mixed model.
| Model | Urban minus rural (mmHg) | Standard error | p-value |
|---|---|---|---|
Ordinary regression, lm() | 1.49 | 0.74 | 0.044 |
Mixed model, lmer() | 1.67 | 1.96 | 0.40 |
The ordinary regression suggests a statistically significant difference, and the mixed model shows that the data cannot distinguish urban from rural clinics. The estimate barely changes (1.49 against 1.67 mmHg), but the standard error rises from 0.74 to 1.96 and the p-value from 0.044 to 0.40, because the information about clinic_urban comes from 30 clinics rather than 966 patients. When two outputs like these are compared, the estimate, the standard error and the p-value are read in turn, and the model that allows for clustering is the one to report.
A clustered dataset therefore needs a method that allows for the clustering, and two families of methods are used throughout this lesson. Mixed models add a random effect for each cluster. By this we mean that each clinic is given its own shift up or down from the overall baseline, and rather than estimating 30 separate shifts as fixed numbers, the model treats the shifts as varying around zero and estimates how much they vary. For example, the mixed model in Table 5.2 estimates how far a typical clinic sits above or below the average, and it uses that information to judge how uncertain the urban minus rural difference is. Generalized estimating equations (GEE) take a different route. They fit an ordinary-looking regression with no cluster effects, so the results describe the population as a whole, and then correct the standard errors so that they allow for the correlation within clusters. In other words, a mixed model handles clustering by building the clusters into the model, whereas GEE handles it by adjusting how the uncertainty is calculated. Both need a variable that identifies the clusters. Simpler approaches also exist, such as analysing cluster averages or adding a separate indicator variable for every cluster, but they lose information or cannot estimate the effects of cluster-level predictors, and this lesson does not use them. Table 5.3 lists the three models that the lesson fits, with the outcomes they handle, the R function for each and the sections in which they are used.
Table 5.3. Methods for dependent data used in this lesson.
| Method | Outcome | R function | Used in |
|---|---|---|---|
| Linear mixed model | Continuous | lme4::lmer() (with lmerTest for p-values) | Sections 2 and 4 |
| Generalized linear mixed model (GLMM) | Binary or count | lme4::glmer() | Section 3 |
| Generalized estimating equations (GEE) | Continuous, binary or count | geepack::geeglm() | Sections 3 and 4 |
The mixed model showed that ignoring the clinics understated the standard error for urban clinics by a large factor. The ICC and the design effect, introduced next, predict the size of that factor from the strength of the clustering.
3.1 Measuring Clustering: The ICC, the Design Effect and the Effective Sample Size
Two linked quantities describe how strongly a dataset is clustered. The ICC measures how alike observations in the same cluster are, and the design effect and the effective sample size convert the ICC into a loss of information.
3.1.1 The Intracluster Correlation Coefficient
The intracluster correlation coefficient (ICC) is a measure of how much of the variation in an outcome is due to the clusters. To obtain it, the total variance of the outcome is divided into two parts. The first is a part between clusters, which reflects how much the cluster averages differ from one another. The second is a part within clusters, which reflects how much people in the same cluster differ from one another. The ICC is the share of the total that lies between clusters. By this we mean that if the clinic averages are spread far apart while patients within each clinic are similar, most of the variation is between clinics and the ICC is large; if instead the clinic averages are almost identical and all of the variation comes from differences among patients in the same clinic, the ICC is close to 0. Equation 5.1 expresses this share as a ratio of the two variances.
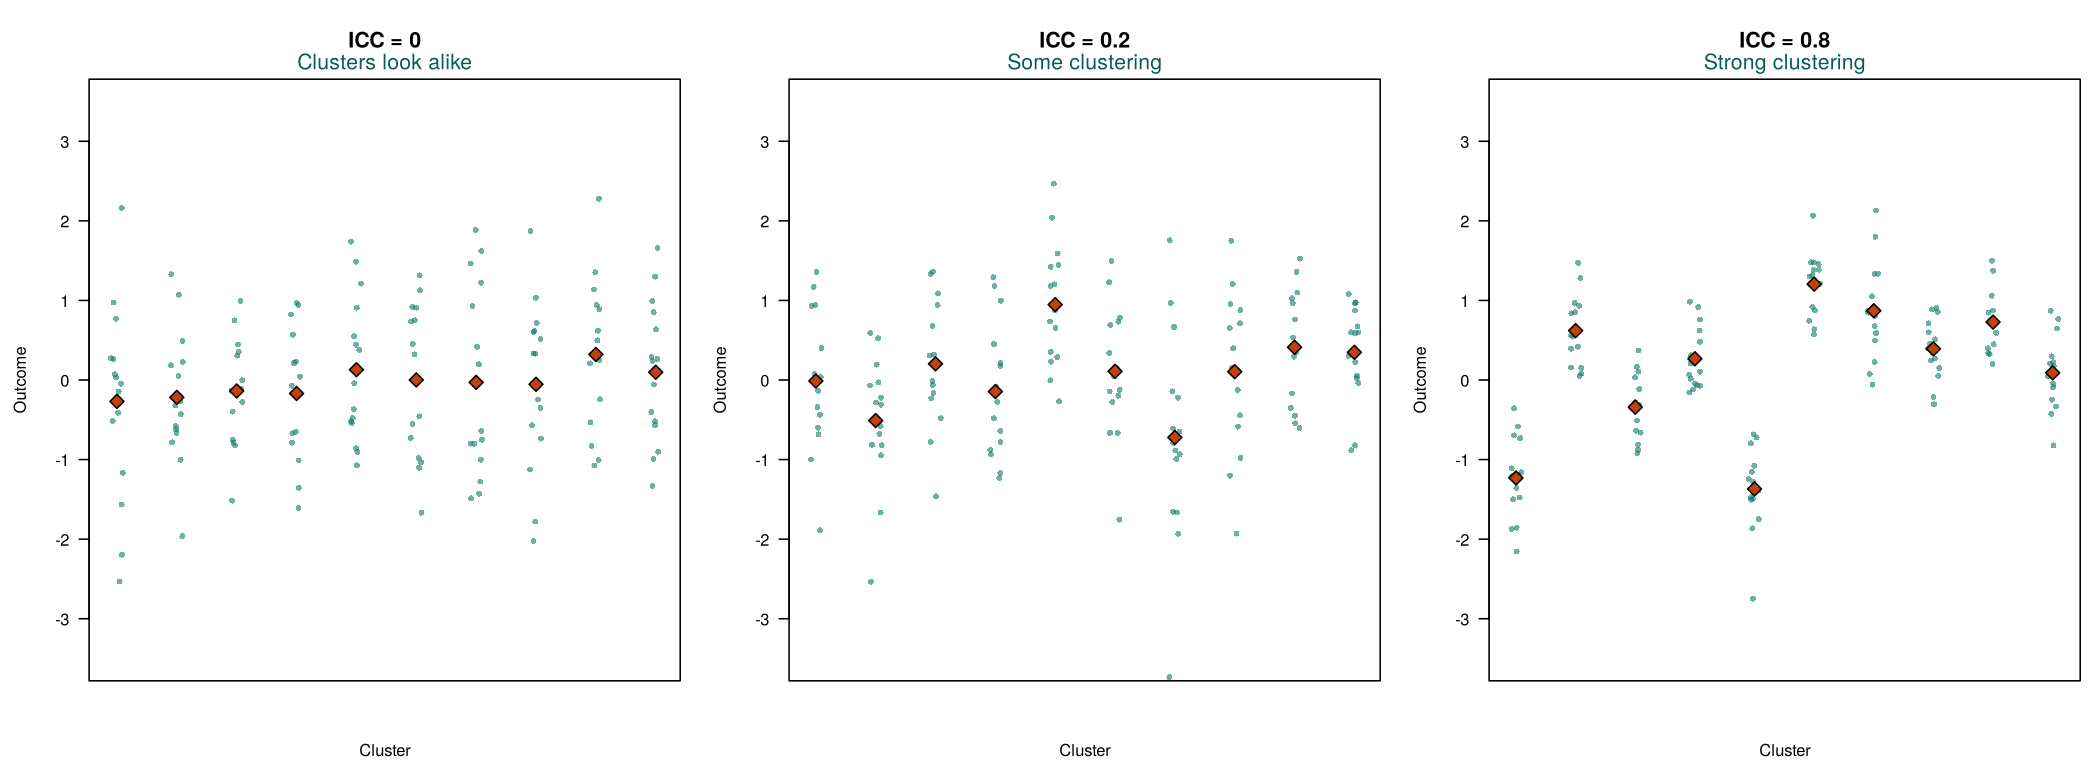
The ICC can also be read as the correlation between the outcomes of two people chosen from the same cluster. These two readings describe the same quantity, and they are linked in a simple way. When a large share of the variation lies between clusters, knowing which cluster a person belongs to tells you a lot about their outcome, and so two people from the same cluster tend to have similar outcomes, which is what a high correlation means. When almost none of the variation lies between clusters, two people from the same cluster are no more alike than two people chosen at random, and the correlation is close to 0. A statistic of the same form, the intraclass correlation coefficient, is also used for a different application: measuring the reliability of a score across occasions or raters. Figure 5.3 shows simulated clusters with three values of the ICC.
Worked Example 5.1 applies Equation 5.1 to the clinic data. It reads the ICC that R reports in Activity 5.1, at the end of this section, and shows how it follows from the two variances; watch that the ICC is the between-clinic share, not the within-clinic share.
Worked Example 5.1: The ICC for Blood Pressure
A mixed model with no predictors (Activity 5.1 below) estimates a between-clinic variance of 22.10 and a within-clinic variance of 104.34. The line icc <- vc$vcov[1] / sum(vc$vcov) in Activity 5.1 divides the first of these by their total, as Equation 5.1 does, and R prints 0.175. About 17.5% of the variation in systolic blood pressure lies between clinics, and the blood pressures of two patients from the same clinic have a correlation of about 0.175.
ICCs for clinics, schools and neighbourhoods in health research are often between 0.01 and 0.1, so a value of 0.175 indicates strong clustering. Small ICCs still matter when clusters are large, as the design effect shows.
The ICC of 0.175 measures the strength of the clustering in the clinic data, and both of its readings, as a share of the variation and as a correlation, describe the same quantity. How much information this clustering removes depends also on the size of the clusters.
3.1.2 The Design Effect and the Effective Sample Size
The design effect (DEFF) expresses the ICC as a loss of information. By this we mean that it tells you how many times larger the variance of an estimate, such as an average or a comparison of cluster characteristics, is in a clustered sample than it would be in a simple random sample of the same number of independent people. A design effect of 1 means that clustering costs nothing, and a design effect of 2 means that the clustered sample carries only about as much information as half as many independent people. The design effect depends on both the ICC and the average cluster size. The ICC matters because it measures how alike people in the same cluster are, and the cluster size matters because the more people are taken from each cluster, the more of them repeat information that the others in their cluster have already supplied. For example, even a modest ICC produces a large design effect when every cluster contains dozens of people. Equation 5.2 gives the design effect and the effective sample size that follows from it.
For the clinic data, Activity 5.1 obtains both quantities in R: the line deff <- 1 + (m_bar - 1) * icc applies Equation 5.2 to the average clinic size of 32.2 and the unrounded ICC and prints a design effect of 6.45, and nrow(clinics) / deff prints an effective sample size of about 150 (149.7). For questions about clinic characteristics, the 966 clustered patients therefore carry about as much information as 150 independent people. The formula also shows why cluster size matters: with 32 people per cluster, even an ICC of 0.05 gives a design effect of 2.55, which R returns from 1 + (32 - 1) * 0.05 and which reduces the effective sample size by more than half. At the planning stage the same formula is used to inflate the sample size of a study; this section uses it to describe the information lost in an analysis.
The design effect can also be read directly: it is the factor by which clustering inflates the variance of an estimate about a cluster characteristic, compared with a simple random sample of the same number of people. A design effect of 6.45 means that such an estimate is about 6.45 times as variable as it would be from 966 independent patients, so its standard error is about 2.5 times as large, which is the square root of the design effect and which R returns from sqrt(deff). The comparison in Table 5.2 showed an inflation of this size, with the standard error for urban clinics rising from 0.74 to 1.96. When a study is planned, the same number works in reverse: the sample size needed from a simple random sample is multiplied by the design effect. For example, for a study that recruits 25 people from each cluster and expects an ICC of 0.05, R returns a design effect of 2.2 from 1 + (25 - 1) * 0.05, so a study that needs the precision of 400 independent people needs about 880 people, which R returns from 400 * 2.2, or about 36 clusters of 25 (880 / 25): more than twice as many people as a simple random sample would need. Because the design effect grows with the number of people per cluster, extra people from a cluster that is already in the sample add little new information, and spreading the sample over more clusters usually gains more precision than recruiting more people from each one.
Dependence therefore arises from the design of a study, the ICC and the design effect measure its strength, and ignoring it understates the uncertainty, above all for cluster-level predictors. The narrated R walkthrough below demonstrates all of the methods in Table 5.3 on the lesson’s two datasets, and Activity 5.1 then lets you reproduce the main results of this section, from the ICC and the design effect to the comparison in Table 5.2: run the script alongside the text version and answer the questions from your own output.
Narrated R walkthrough: Mixed Models and GEE in R
This walkthrough uses the same two datasets as this lesson. It measures clustering with the intracluster correlation coefficient, fits and checks a linear mixed model, models a binary outcome with a generalized linear mixed model and with GEE, and analyses repeated measurements over time.
Open the Mixed Models and GEE in R walkthroughText version of the activity: the code of the run-along script, its console output and notes on reading it.
# install.packages("lmerTest")   # run once if needed; it also installs lme4
library(lmerTest)    # loads lme4 (for lmer()) and adds p-values
clinics <- read.csv("https://heal-learn.ca/r-activities/data/phaa_clinics.csv")   # course data, read from the website
clinics$clinic_id <- factor(clinics$clinic_id)   # a label for each clinic
clinics$clinic_urban <- factor(clinics$clinic_urban, levels = c("rural", "urban"))
nlevels(clinics$clinic_id)                     # how many clinics?
summary(as.vector(table(clinics$clinic_id))) # patients per clinicThe factor() line tells R to treat clinic_id as a label for each clinic. The file holds 30 clinics with between 18 and 45 patients each (mean 32.2). When lmerTest loads, it prints start-up messages (for example, that it masks lmer() from lme4); they are not errors.
m0 <- lmer(sbp ~ 1 + (1 | clinic_id), data = clinics)
vc <- as.data.frame(VarCorr(m0))
vc[, c("grp", "vcov")]                # variance between and within clinics
icc <- vc$vcov[1] / sum(vc$vcov)      # intracluster correlation coefficient
iccThe term (1 | clinic_id) asks for a separate baseline for each clinic. The variance between clinics is 22.10 and the variance within clinics (Residual) is 104.34. The icc line divides the first by the total of the two, and R prints the ICC, 0.175: about 17.5% of the variation in blood pressure lies between clinics.
m_bar <- mean(table(clinics$clinic_id))   # average clinic size
deff <- 1 + (m_bar - 1) * icc             # design effect
deff
nrow(clinics) / deff # effective sample sizeR prints a design effect (deff) of 6.45 and an effective sample size of about 150 (149.7): for questions about clinic characteristics, the 966 patients carry about as much information as 150 independent people.
naive <- lm(sbp ~ clinic_urban, data = clinics)                      # ignores clinics
mixed <- lmer(sbp ~ clinic_urban + (1 | clinic_id), data = clinics)   # allows for clinics
summary(naive)$coefficients
summary(mixed)$coefficientsReading the output. The first table is from lm(): urban clinics average 1.49 mmHg higher, with a standard error of 0.74 and a p-value of 0.044. The second table is from lmer(): the difference is 1.67 mmHg, but the standard error is 1.96 and the p-value is 0.40. The df column (about 27) reflects the 30 clinics, which are the real units of information for a clinic-level predictor.
R Reflect on what you just ran
Answer each question from your own output, as on the final exam: find the number, say what it means in plain words, and say what it implies for the analysis.
1. Interpret the ICC from m0 (the value of icc) in plain words, in two ways. Is this ICC large by the benchmark taught in the course?
2. Interpret the design effect (deff) and the effective sample size. A colleague analysed these 966 patients with ordinary regression and saw no sign of a problem. Why not, and how should clustering be recognised?
lm() or glm() shows that observations are clustered, so the colleague's clean output is no evidence that the patients are independent. Clustering is recognised from the study design (patients sampled through clinics) and from a variable that identifies the clusters (clinic_id).3. Run your own code: at the end of the script, type confint(mixed, parm = "beta_", method = "Wald") and run it. Compare the standard error and p-value for clinic_urbanurban in the two models, and explain why they change so much. Interpret the urban-clinic coefficient from the mixed model, with its 95% confidence interval. Which result should be reported, and why?
confint() line, −2.17 to 5.51, includes 0, so the data cannot tell urban and rural clinics apart; the comparison is also observational. Report the mixed model, because it allows for patients in the same clinic being alike; the ordinary regression overstates the evidence.Your output from Activity 5.1 confirms that the 30 clinics, not the 966 patients, carry the information about clinic characteristics. The key takeaways below draw the section together before its knowledge check.
Key Takeaways
- 1.1 Dependent data come in two common forms, clustered data and repeated measures, and you recognise both from how the study was designed rather than from the numbers in the dataset. Observations are dependent when they share something: patients in the same clinic share doctors and a local population, students in a school share teachers and facilities, and the visits of one person share that person's habits and baseline health. When you read a question, ask how people were sampled and measured; if they were recruited in groups or measured more than once, the data are clustered, and the cluster is the unit whose members tend to be alike (the clinic, the school, or the person in a repeated-measures study, not the visit or the year). Then name the variable that identifies the clusters, such as
clinic_idor a participant ID, because every method in this lesson needs it. Do not wait for R to warn you: nothing in the output oflm()orglm()shows that observations are clustered, so a clean regression table is no evidence that the data are independent. - 2.1 Ignoring clustering usually leaves the estimates much the same, but it makes the model far too sure of them. A model that assumes independence counts every observation as a separate piece of information, yet people in the same cluster partly repeat what the others have already said, so the model believes it has more information than it really does. As a result the standard errors are too small, the confidence intervals too narrow and the p-values too small, and an analysis can report a statistically significant association that the data do not support. When a question asks what goes wrong, name all three quantities and the direction in which each is wrong, and describe the problem as overconfidence about precision rather than as a wrong estimate.
- 2.2 Before you interpret any standard error from clustered data, decide whether each predictor describes the cluster or the person. A cluster-level predictor, such as an urban clinic or a school-wide program, takes one value for everyone in a cluster, so 966 patients in 30 clinics supply only 30 independent values of it, and its standard error is the one most understated when clustering is ignored. A person-level predictor, such as smoking or age, varies among people within each cluster, so the model can compare people in the same clinic, and allowing for clustering changes its standard error little or can even make it smaller (for smoking it fell from 0.79 to 0.70 in the Section 2 model). A quick test is to ask whether two people in the same cluster could have different values: if they cannot, the predictor is cluster-level. In an exam answer, expect and explain a large rise in the standard error and p-value for a cluster-level predictor and little change for a person-level one.
- 2.3 Putting an ordinary regression and a mixed model side by side is the clearest way to see what clustering does. In the clinic data, the urban minus rural difference in blood pressure was similar in both models (1.49 mmHg from
lm()and 1.67 mmHg fromlmer()), but the standard error rose from 0.74 to 1.96 and the p-value from 0.044 to 0.40, so an apparently significant result disappeared once the 30 clinics were treated as the real units of information. When a question gives you two outputs like these, compare the estimate, the standard error and the p-value in turn, say that you would report the model that allows for clustering, and explain the change by pointing out that the predictor is measured on the cluster. Mixed models and GEE are the two standard remedies, and the rest of the lesson shows you how to fit and read them. - 3.1 The ICC tells you how alike people in the same cluster are, and you can read it in two equivalent ways: as the share of the outcome's variation that lies between clusters, or as the correlation between the outcomes of two people from the same cluster. R obtains it from the two variances of a mixed model with no predictors: the line
vc$vcov[1] / sum(vc$vcov)gives the between-cluster share of the total, between ÷ (between + within), and prints 0.175 for blood pressure in the clinics; a common slip in reading it is to describe the within-cluster share instead. Judge its size against the usual range of 0.01 to 0.1 for clinics, schools and neighbourhoods, but remember that a small ICC still matters when clusters are large. The design effect, 1 + (average cluster size − 1) × ICC, is the factor by which clustering inflates the variance of an estimate about a cluster characteristic (R printed 6.45 here), and the effective sample size, n ÷ DEFF, is the number of independent people who would carry the same information (about 150 here), so keep the phrase "for questions about cluster characteristics" in your interpretation. Because the design effect grows with the number of people per cluster, a study gains more precision from extra clusters than from extra people in the clusters it already has, and a planned clustered study needs the sample size of a simple random sample multiplied by the design effect.
1. A health unit surveys 840 adults living in 40 social-housing apartment buildings (about 21 per building) about respiratory symptoms, and the data file has a column building_id. A colleague fits lm() and says: “The output showed no warning, so the 840 adults can be treated as independent.” Which response is correct?
building_id recorded. Nothing in the output of lm() or glm() (coefficients, R² or residuals) signals clustering, so dependence is recognised from the study design and from the variable that identifies the clusters; adults who share a building share conditions that affect their symptoms, so their outcomes are alike. The tempting answer that each adult was interviewed only once confuses being measured once with being independent: people sampled in groups that share a setting are not independent. (Section 1, 1.1 Recognising Dependent Data and the callout “Clustering Cannot Be Seen in the Regression Output”; Objective 1.1)2. In the housing survey (840 adults in 40 buildings), a mixed model with no predictors, m0 <- lmer(symptoms ~ 1 + (1 | building_id), data = housing), was fitted and its ICC obtained in R as shown below. What does this ICC mean?
icc, 0.15, which is the building variance (the building_id row, 3.01) as a share of the total of the two variances (Equation 5.1), and the benchmark that ICCs for clinics, schools and neighbourhoods are often between 0.01 and 0.1, so 0.15 indicates strong clustering. The ICC is a share of the variation, not a share of the people, and the within-building share (about 85%) is the remainder, not the ICC. Even a small ICC matters when clusters are large, as the design effect in Question 3 shows, so an ICC is not on its own a reason to ignore clustering. (Section 1, 3.1.1 The Intracluster Correlation Coefficient, Equation 5.1 and Worked Example 5.1; Objective 3.1)3. The analyst continues in R with the ICC from Question 2 and the average building size of 21 adults, as shown below. Which statement reads the two results correctly?
4. In the housing survey, 20 of the 40 buildings have a smoke-free policy. The symptom score was modelled with lm(), which ignores the buildings, and with lmer() with a random intercept for each building, giving the results below for the policy. Which result should be reported, and why?
| Model | Estimate | Standard error | p-value |
|---|---|---|---|
lm() | −1.10 | 0.30 | < 0.001 |
lmer() | −1.20 | 0.62 | 0.06 |
lmer() result. The information needed is that the policy is a building-level predictor and that, between the two models, the estimate barely changes (−1.10 against −1.20) while the standard error doubles (0.30 to 0.62, about √4.0 = 2 times, as the design effect of Question 3 suggests) and the p-value rises from below 0.001 to 0.06. A model that treats clustered observations as independent overstates how much information it has, so for a cluster-level predictor its standard error, confidence interval and p-value are too small; the mixed model shows that 40 buildings give only weak evidence about the policy. The smaller standard error of lm() is tempting, but it comes from a false assumption of independence, not from extra information. (Section 1, 2.1 Why Ignoring Dependence Makes Results Look Too Precise and 2.3 Comparing an Ordinary Regression with a Mixed Model, Table 5.2; Objectives 2.1 and 2.3)5. The same two models also include two predictors measured on each adult, with the standard errors shown below. Why does the standard error for the smoke-free policy double, while those for current smoking and age barely change?
| Predictor | SE in lm() | SE in lmer() |
|---|---|---|
| Smoke-free policy (building) | 0.30 | 0.62 |
| Current smoker (adult) | 0.26 | 0.24 |
| Age, per 10 years (adult) | 0.090 | 0.088 |
6. A health authority surveyed 30 patients in each of 32 emergency departments, and the ICC for a patient-experience score is 0.10. For next year, a colleague says: “Surveying 40 patients in each of the same 32 departments gains just as much precision as adding 10 more departments of 30 patients.” The effective sample size of each plan, the number of patients divided by its design effect, was obtained in R as shown below. Which response is correct?
Linear Mixed Models
Clinics differ by several mmHg, after adjustment
Three plots check most of the assumptions
Overview
This section presents the linear mixed model, the standard model for a continuous outcome when observations are clustered. It continues with systolic blood pressure in the 30 clinics of phaa_clinics.csv, now with four predictors: age, gender, smoking and whether the clinic is urban. It explains what a random intercept adds to an ordinary linear regression, how to read the fixed effects, the estimated clinic shifts and the variance components from the R output, which checks a mixed model needs, and what a random slope adds and why it often cannot be estimated.
Learning Objectives
- 4.1 Describe a random intercept and explain how a linear mixed model differs from an ordinary linear regression.
- 4.2 Interpret the fixed effects of a random-intercept model fitted with
lmer(), and the estimated shift of a single cluster. - 4.3 Interpret the random-effect variances and the adjusted ICC from R output.
- 5.1 Check a linear mixed model with residual plots, a Q-Q plot of the cluster effects, the number of clusters and the singular-fit check.
- 5.2 Explain what a random slope adds, when it is used, and what a singular-fit or convergence warning means for the choice of model.
4.1 The Random-Intercept Model
An ordinary linear regression has a single intercept and treats every patient as independent. In other words, it assumes that every clinic starts from the same baseline blood pressure, and that any difference between two patients with the same predictor values is purely a matter of individual variation. A random-intercept model relaxes this assumption by giving each cluster its own intercept. By this we mean that each clinic's baseline is made up of two parts: the overall intercept, which is shared by all clinics, plus a cluster-specific shift, which moves that clinic's baseline up or down. For example, a clinic that serves an older or less healthy population might have a shift of several mmHg above the average, while another clinic might sit a few mmHg below it.
What makes the intercept "random" is the way these shifts are treated. Rather than estimating a separate coefficient for each of the 30 clinics, the model treats the shifts as a random sample from a normal distribution with mean 0, and it estimates the variance of that distribution, which describes how much the clusters differ (Laird & Ware, 1982). A small variance means that the clinic baselines are close together, and a large variance means that they are spread far apart. Equation 5.3 writes the model for systolic blood pressure in the clinic data.
The name "mixed" refers to the two kinds of effects in the model. The fixed effects (β0 to β4) are the coefficients for the predictors, read as differences in average blood pressure, as in ordinary linear regression. The random effects (uj) are the clinic shifts, summarised by their variance. This way of handling the clinics has an important advantage. If the model instead included 30 separate clinic coefficients, those coefficients would absorb every difference between clinics, including the difference between urban and rural clinics, and the model could no longer estimate the effect of a clinic-level predictor at all. Summarising the 30 clinics with one variance avoids this problem. Because the clinic shifts are described by their spread rather than fixed one by one, the model can allow for the clustering and still estimate the effect of a clinic-level predictor such as clinic_urban, with a standard error that reflects the 30 clinics. Click each of the three cards below to review the random intercept, with its lmer() notation (1 | clinic_id), the fixed effects and the variance components.
The random intercept therefore gives each clinic its own baseline while the fixed effects describe the predictors. With the parts of the model defined, the next part reads the fixed effects from the R output for the clinic data.
4.2 Interpreting the Fixed Effects and Cluster Shifts
Activity 5.2 at the end of this section fits the model with lmer() after loading the lmerTest package, which adds p-values to the fixed effects. The output has two main blocks, the fixed effects and the random effects. Table 5.4 summarises the fixed-effects block, with a 95% confidence interval and an interpretation for each predictor.
Table 5.4. Fixed effects from the random-intercept model for systolic blood pressure.
| Fixed effect | Estimate (mmHg) | 95% CI | p-value | Interpretation |
|---|---|---|---|---|
| Age (per year) | 0.41 | 0.37 to 0.45 | < 0.001 | Each extra year of age is associated with 0.41 mmHg higher blood pressure. |
| Female | −2.80 | −3.88 to −1.73 | < 0.001 | Women average 2.8 mmHg lower than men. |
| Smoker | 5.00 | 3.63 to 6.37 | < 0.001 | Smokers average 5.0 mmHg higher than non-smokers. |
| Urban clinic | 1.85 | −1.85 to 5.54 | 0.34 | There is no clear evidence of a difference between urban and rural clinics. |
Each estimate is read like a coefficient of an ordinary linear regression and holds the other predictors constant, so it compares patients with the same values of the other predictors in the same clinic: smokers, for example, average 5.0 mmHg higher than non-smokers of the same age and gender attending the same clinic. Because the clinics were not assigned to be urban or rural and the patients were not assigned to smoke, these fixed effects describe associations, not the effects of changing a predictor. The df column of the output shows about 937 degrees of freedom for the patient-level predictors and about 28 for urban clinics. The degrees of freedom reflect how much independent information stands behind each estimate. For age, gender and smoking, the information comes from comparisons among the 966 patients, so the degrees of freedom are large. For urban clinic, by contrast, the information comes from the 30 clinics, so the degrees of freedom are close to the number of clinics, and the test for this predictor is correspondingly less certain. The confidence interval for urban clinic includes 0, so the data cannot tell urban and rural clinics apart.
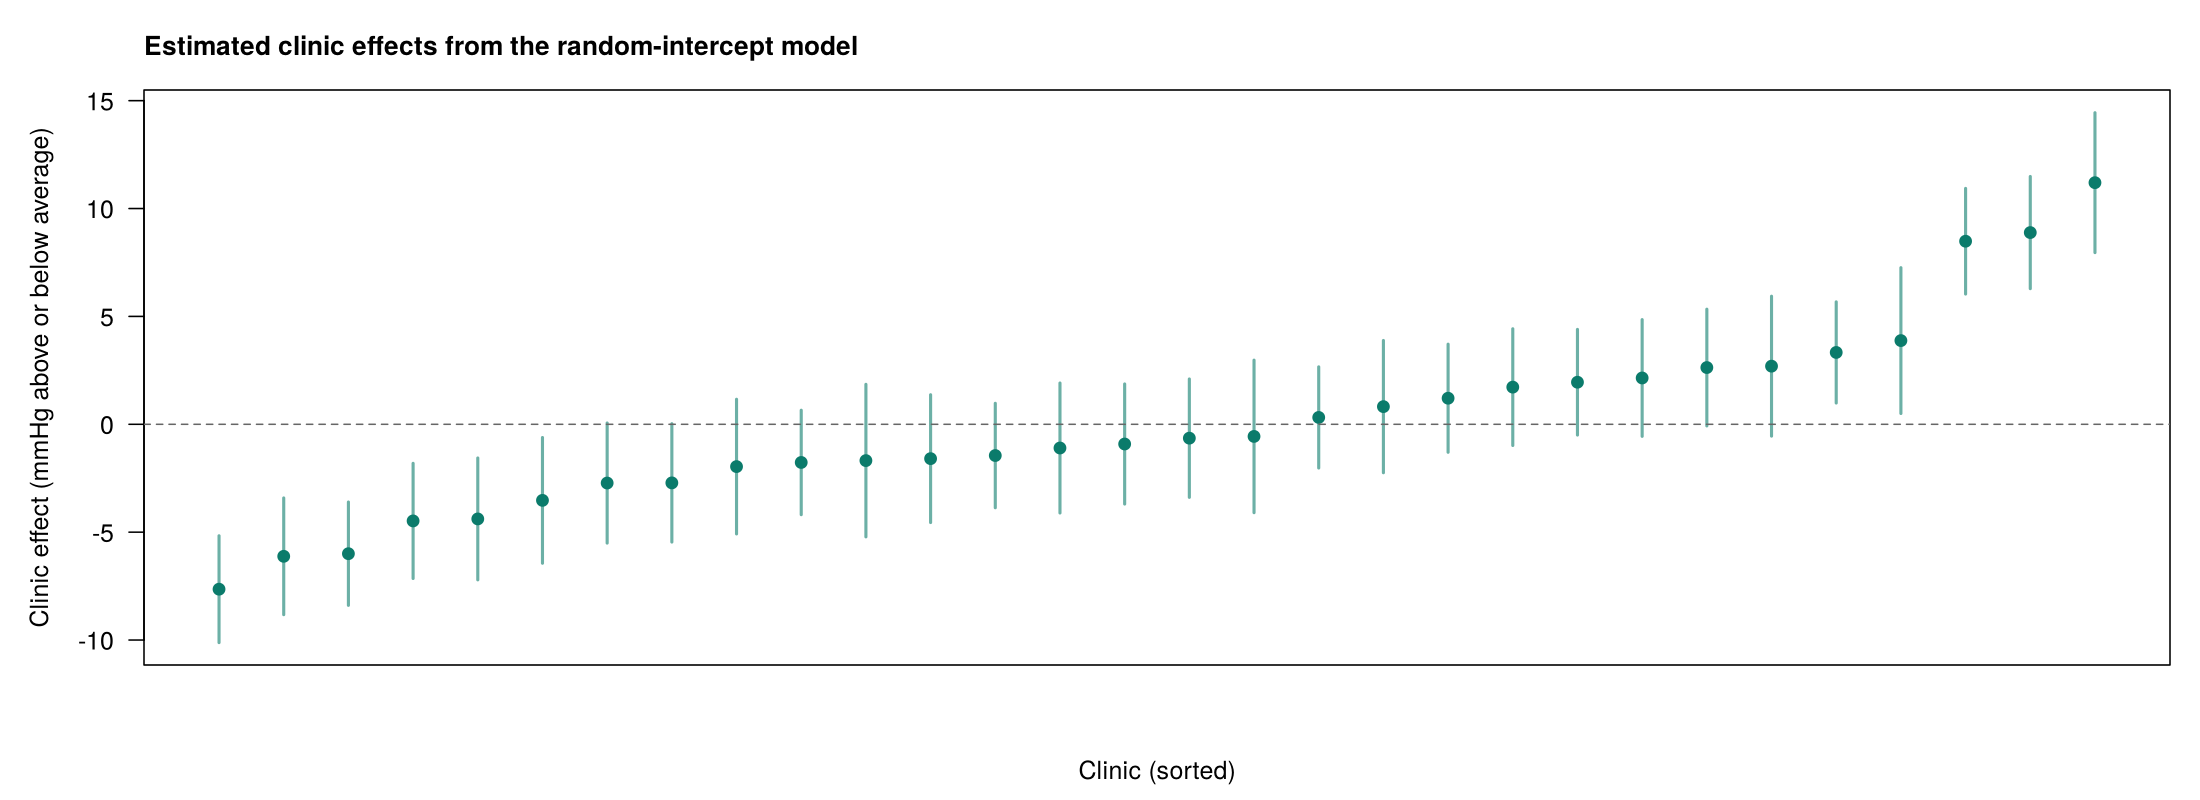
The model also estimates a shift for each clinic. Figure 5.4 shows the estimated shifts of the 30 clinic baselines from the overall average.
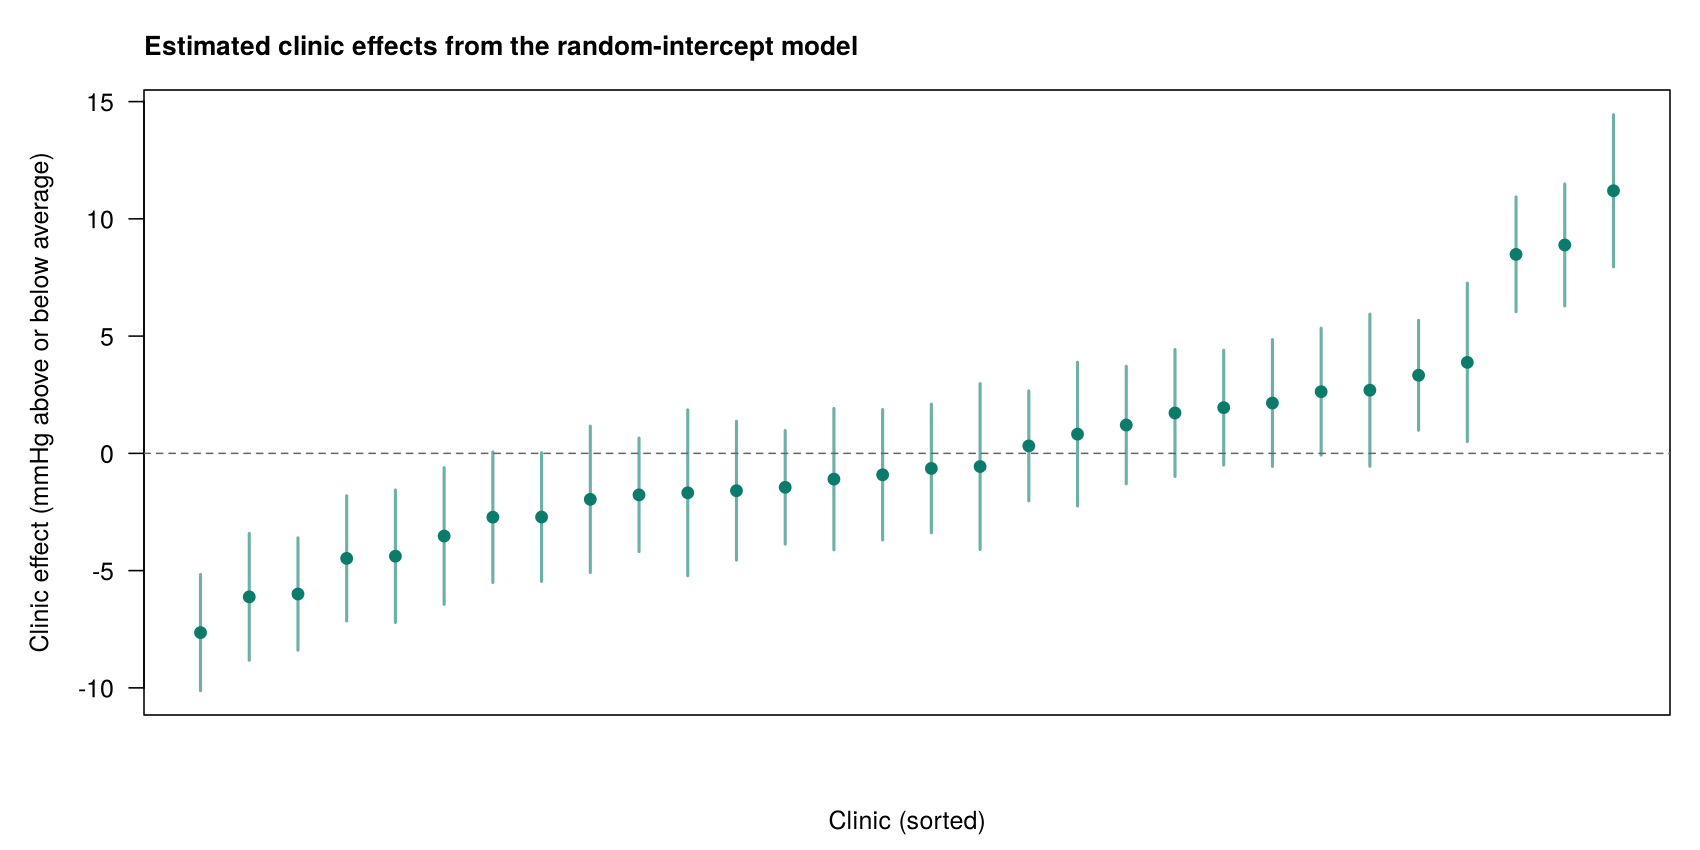
An estimated shift is read for the whole clinic: patients of a clinic with a shift of +8 mmHg have blood pressures about 8 mmHg higher, on average, than patients with the same age, gender, smoking status and clinic type in an average clinic. The shift describes a difference that the predictors in the model do not explain, such as local practices or the population a clinic serves, not the effect of any measured variable. Worked Example 5.2 puts the fixed effects and a clinic shift together to predict blood pressure for two patients; watch what the shift does to each prediction and to the difference between them.
Worked Example 5.2: Predicted Blood Pressure for Two Patients
For a 50-year-old male non-smoker in a rural clinic, predict() in R gives 110.4 mmHg in an average clinic, and for a 50-year-old male smoker in the same clinic it gives 115.4 mmHg. The two patients differ only in smoking, so the gap between the predictions is the smoking coefficient of 5.0 mmHg. In a clinic whose estimated shift is +8 mmHg, both predictions rise by 8 mmHg, but the difference between them stays 5.0 mmHg, because the clinic shift is shared by everyone in the clinic.
The worked example shows that a fixed effect compares patients within a clinic and a clinic shift moves the whole clinic. The spread of the shifts in Figure 5.4 is summarised by the clinic variance, which the next part reads from the random-effects block.
4.3 The Variance Components and the Adjusted ICC
The random effects block reports a clinic variance of 21.57 (standard deviation 4.64 mmHg) and a residual variance of 68.94 (standard deviation 8.30 mmHg). The standard deviations are in the units of the outcome, which makes them easier to picture. For example, a clinic standard deviation of 4.64 mmHg means that a typical clinic's baseline sits roughly 4 or 5 mmHg above or below the average clinic, after allowing for the predictors, while a residual standard deviation of 8.30 mmHg means that patients within the same clinic typically differ from their clinic's expected value by around 8 mmHg. The adjusted ICC, which the line vc$vcov[1] / sum(vc$vcov) in Activity 5.2 prints as 0.24, is the clinic share of the total of these two variances. It is larger than the ICC of 0.175 from the model with no predictors, because age, gender and smoking explain much of the variation among patients within clinics (the residual variance falls from 104.34 to 68.94) but little of the variation between clinics (about 22 in both models). Because the between-clinic part stayed about the same while the within-clinic part shrank, the between-clinic part became a larger share of what was left, and so the ICC rose. The adjusted ICC is not always larger, however. Which way it moves depends on which kind of predictor is added. Person-level predictors mainly reduce the residual variance, because they explain why patients in the same clinic differ from one another. A cluster-level predictor that is strongly related to the outcome, by contrast, explains part of the differences between clusters and so reduces the cluster variance. If the cluster variance falls by a larger share than the residual variance, the adjusted ICC is smaller than the ICC from the model with no predictors. Any change in the ICC is therefore explained by looking at which of the two variances fell, and by how much.
These interpretations depend on the model being appropriate for the data, so the next part sets out the checks that a linear mixed model needs.
5.1 Checking a Linear Mixed Model
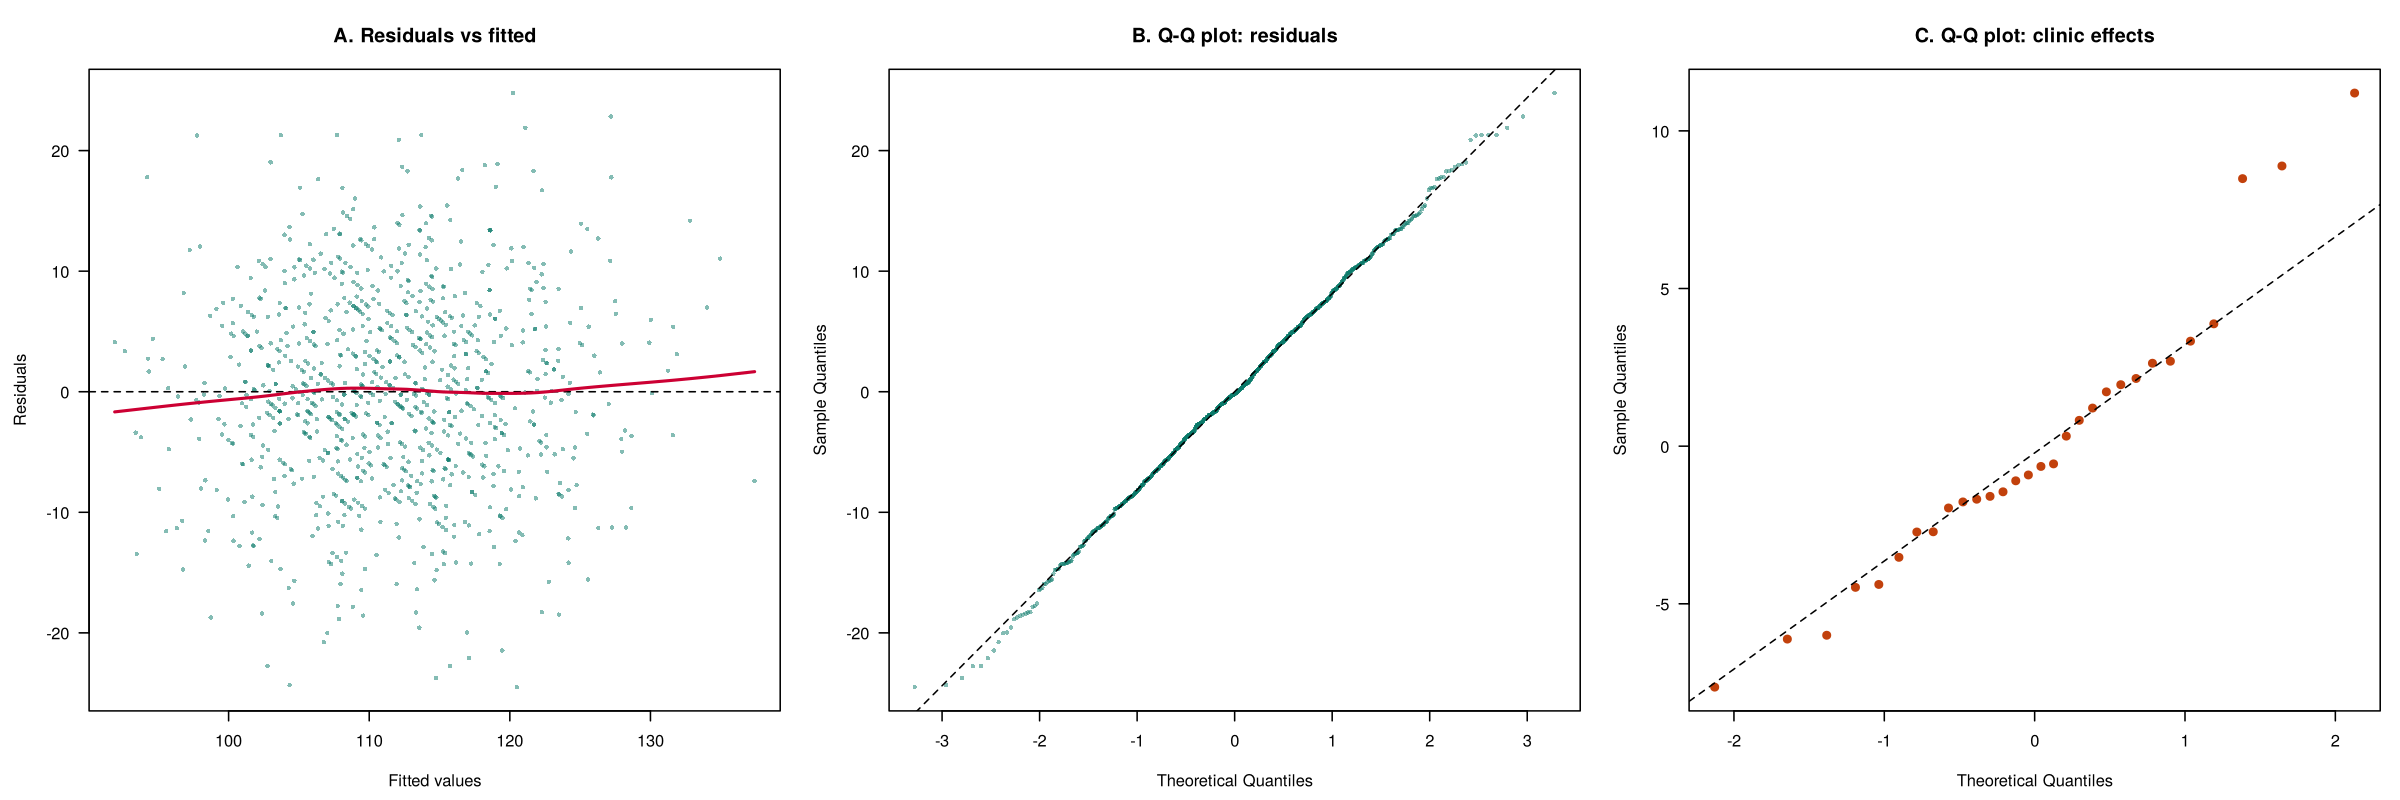
A linear mixed model makes the assumptions of linear regression, applied to the residuals within clusters, and adds assumptions about the clusters. Table 5.5 lists each assumption with what it means and how to check it, and Figure 5.5 shows the three diagnostic plots for the blood pressure model.
Table 5.5. Assumptions of a linear mixed model and how to check them.
| Assumption | What it means | How to check it |
|---|---|---|
| Linearity and equal variance | Each continuous predictor has a straight-line relationship with the outcome, and the residuals have the same spread at every fitted value. | Plot of residuals against fitted values. |
| Normal residuals | The differences among patients within a clinic are roughly normal. | Q-Q plot of the residuals. |
| Normal cluster effects | The clinic shifts come from a roughly normal distribution. | Q-Q plot of ranef(model). With few clusters this check is rough. |
| Enough clusters | The cluster variance is estimated from the clusters, so a reasonable number is needed. | nlevels(clinic_id); about 20 to 30 clusters is a common minimum. |
| Independent clusters | Clinics are unrelated to one another, and patients are independent within a clinic once the clinic effect is allowed for. | Judged from the study design. |
| Cluster variance estimated | The model is not singular, so the cluster variance is not estimated as zero. | isSingular(model) returns FALSE; a "boundary (singular) fit" message signals a problem. |
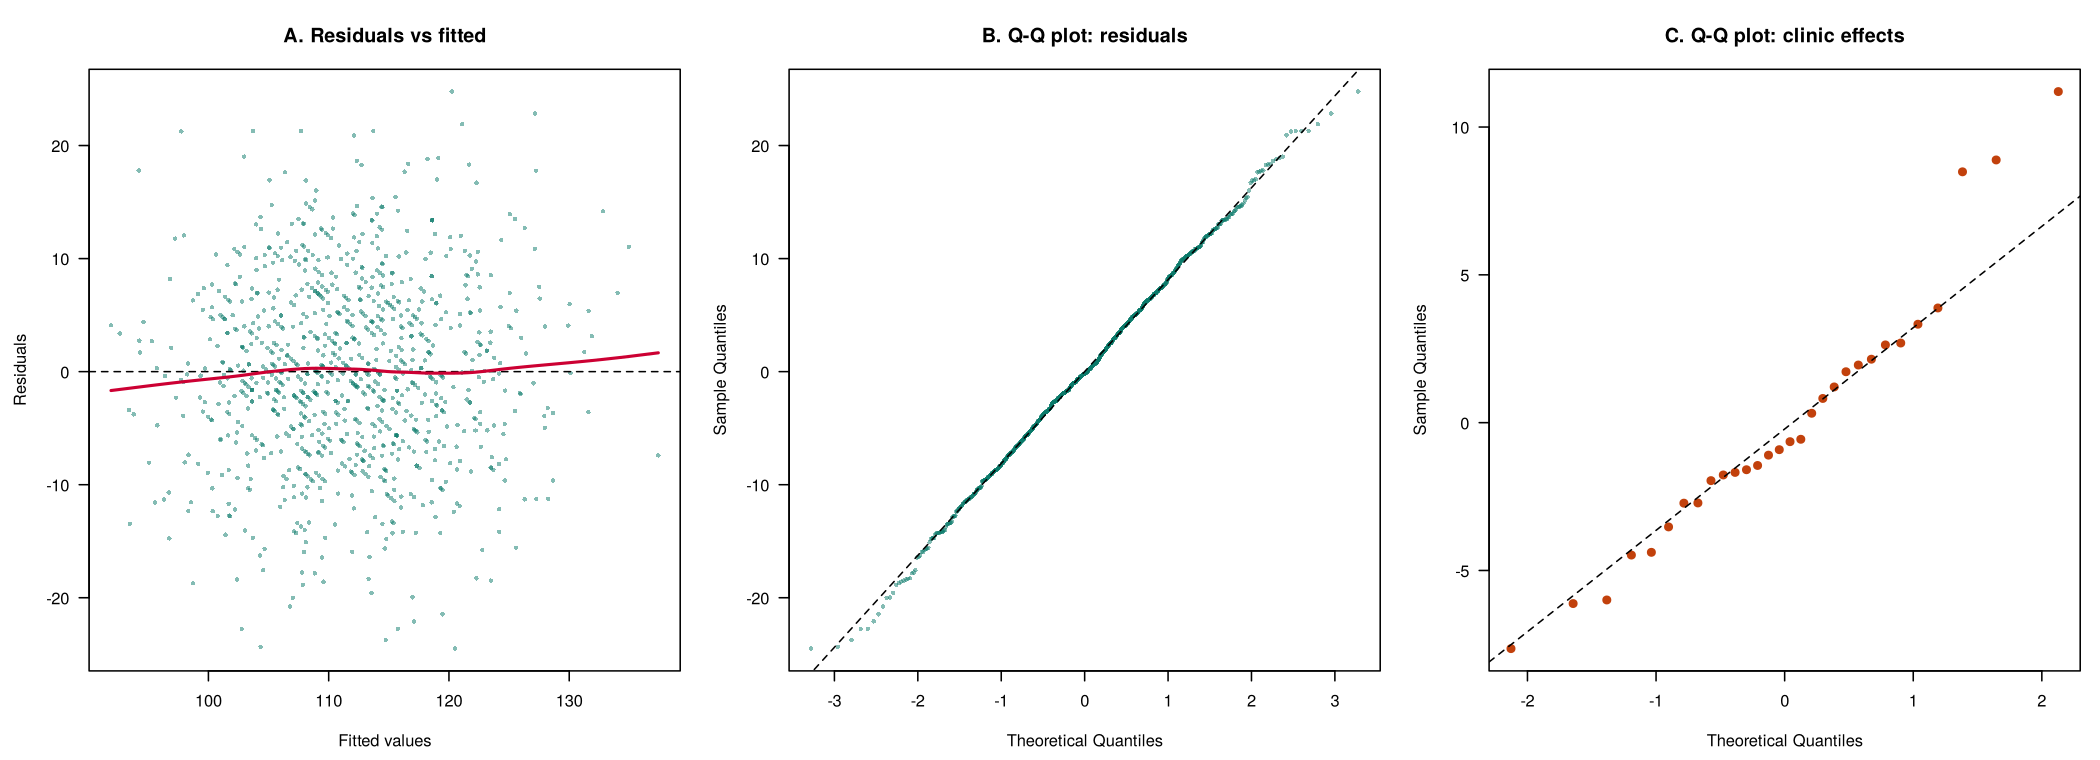
In this example the residual checks look acceptable, there are 30 clinics, and the model is not singular, because isSingular() returns FALSE, which means the clinic variance was estimated rather than collapsing to zero. Passing the singular-fit check does not show that there are enough clusters, which is a separate check. With fewer than about 40 clusters, a small-sample correction to the tests is advised (Hemming & Taljaard, 2023), and the lmerTest output in this section already uses one (Satterthwaite's method). The three high clinics in panel C are a mild departure from normal cluster effects. Fixed-effect estimates are usually not very sensitive to this assumption, so such clinics are reported and investigated rather than treated as a reason to abandon the model, for example to see whether they serve an older population or record blood pressure differently.
The checks support the random-intercept model for the clinic data. The final part of this section considers a more flexible model, in which the effect of a predictor may differ between clinics.
5.2 Random Slopes and Model Warnings
The random-intercept model lets clinic baselines differ but assumes that each predictor has the same effect in every clinic. A random slope lets the effect of a predictor vary between clusters as well. By this we mean that, in addition to each clinic having its own baseline, each clinic can also have its own version of the relationship between a predictor and the outcome. For example, blood pressure might rise by 0.41 mmHg per year of age on average, but more steeply in one clinic and less steeply in another. In lmer(), a random slope for age is written (age | clinic_id), which gives each clinic its own intercept and its own age slope. Just as with the random intercept, the clinic-specific slopes are not estimated one by one; the model estimates how much the slopes vary around the average slope. Random slopes suit research questions about how an effect differs between settings, such as whether a program works better in some schools than others. This added flexibility comes at a cost, however. Measuring how much a slope varies between clusters is much harder than measuring how much a baseline varies, so random slopes need more clusters and more observations per cluster, and with 30 clinics they often produce a singular fit or a convergence warning. This lesson fits random intercepts only.
Both warnings say that the random part of the model is more complex than the data can support. A convergence warning means that R stopped before it was sure it had found the best estimates, and a singular fit means that a variance was estimated at or near zero (or a correlation between the random intercepts and slopes at exactly ±1). It is tempting to read a singular fit for a random slope as evidence that the effect is the same in every clinic, but this is a mistake. Neither warning shows that the effect is the same in every cluster; it shows that the data cannot measure how much the effect varies. In other words, the problem is a lack of information, not a finding about the clinics. The usual response is to return to the simpler random-intercept model, report it, and state that a random slope could not be estimated. If the main fixed effect is almost the same in the two models, the conclusion does not depend on the random slope.
The linear mixed model with a random intercept for each clinic, read through its fixed effects, clinic shifts, variance components and adjusted ICC, and checked against Table 5.5, is the basic model for clustered continuous outcomes. Activity 5.2 lets you fit it in R, run the checks and try a random slope for age: run the script and answer the questions from your own output. Section 3 then applies the same approach to a binary outcome.
Text version of the activity: the code of the run-along script, its console output and notes on reading it.
library(lmerTest)   # loads lme4 and adds p-values to lmer() output
clinics <- read.csv("https://heal-learn.ca/r-activities/data/phaa_clinics.csv")   # course data, read from the website
clinics$clinic_id <- factor(clinics$clinic_id)
clinics$smoker <- factor(clinics$smoker, levels = c("No", "Yes"))
clinics$clinic_urban <- factor(clinics$clinic_urban, levels = c("rural", "urban"))
nlevels(clinics$clinic_id) # how many clinics?R prints messages as it loads lmerTest and lme4; they are not errors. nlevels() confirms 30 clinics, which meets the usual minimum of about 20 to 30 clusters for a mixed model.
lmm <- lmer(sbp ~ age + female + smoker + clinic_urban + (1 | clinic_id),
            data = clinics)
summary(lmm)
confint(lmm, parm = "beta_", method = "Wald")   # 95% CIs for the fixed effects
head(ranef(lmm)$clinic_id, 3) # estimated shifts of clinics 1 to 3 (mmHg)Reading the output. The first lines (the REML criterion and the scaled residuals) can be ignored for now. The Random effects block gives the clinic variance (21.57, standard deviation 4.644 mmHg) and the residual variance among patients within a clinic (68.94, standard deviation 8.303 mmHg), and the line below it confirms 966 patients in 30 clinics. The Fixed effects block is read like a regression table: age 0.41 mmHg per year, women 2.80 mmHg lower than men, smokers 5.00 mmHg higher than non-smokers, and urban clinics 1.85 mmHg higher than rural clinics (p = 0.336), each comparing patients with the same values of the other predictors. The df column shows about 937 degrees of freedom for the patient-level predictors and about 28 for urban clinics, because the information about a clinic-level predictor comes from the 30 clinics. The Correlation of Fixed Effects block can be ignored for now.
The 95% confidence intervals agree with the p-values: only the interval for urban clinics (−1.85 to 5.54) includes 0. The intervals from method = "Wald" use the normal distribution, while the lmerTest p-values use a t distribution with the degrees of freedom shown, so for urban clinics the two can differ slightly. The last lines are the estimated shifts of clinics 1 to 3 from the overall average: +11.2, −1.4 and +8.9 mmHg.
vc <- as.data.frame(VarCorr(lmm))
vc[, c("grp", "vcov")]       # variance between and within clinics
vc$vcov[1] / sum(vc$vcov) # ICC after adjusting for the predictorsThe two variances are 21.57 between clinics and 68.94 among patients within a clinic, and the last line prints the ICC after adjusting for the predictors, 0.24. The model with no predictors (Activity 5.1) gave a clinic variance of 22.10, a residual variance of 104.34 and an ICC of 0.175.
par(mfrow = c(1, 3))         # three plots side by side
plot(fitted(lmm), resid(lmm), main = "Residuals vs fitted")
abline(h = 0, lty = 2)
qqnorm(resid(lmm), main = "Q-Q: residuals"); qqline(resid(lmm))
re <- ranef(lmm)$clinic_id[, 1]   # the 30 clinic shifts
qqnorm(re, main = "Q-Q: clinic effects"); qqline(re)
par(mfrow = c(1, 1))
isSingular(lmm)              # FALSE: the clinic variance was estimated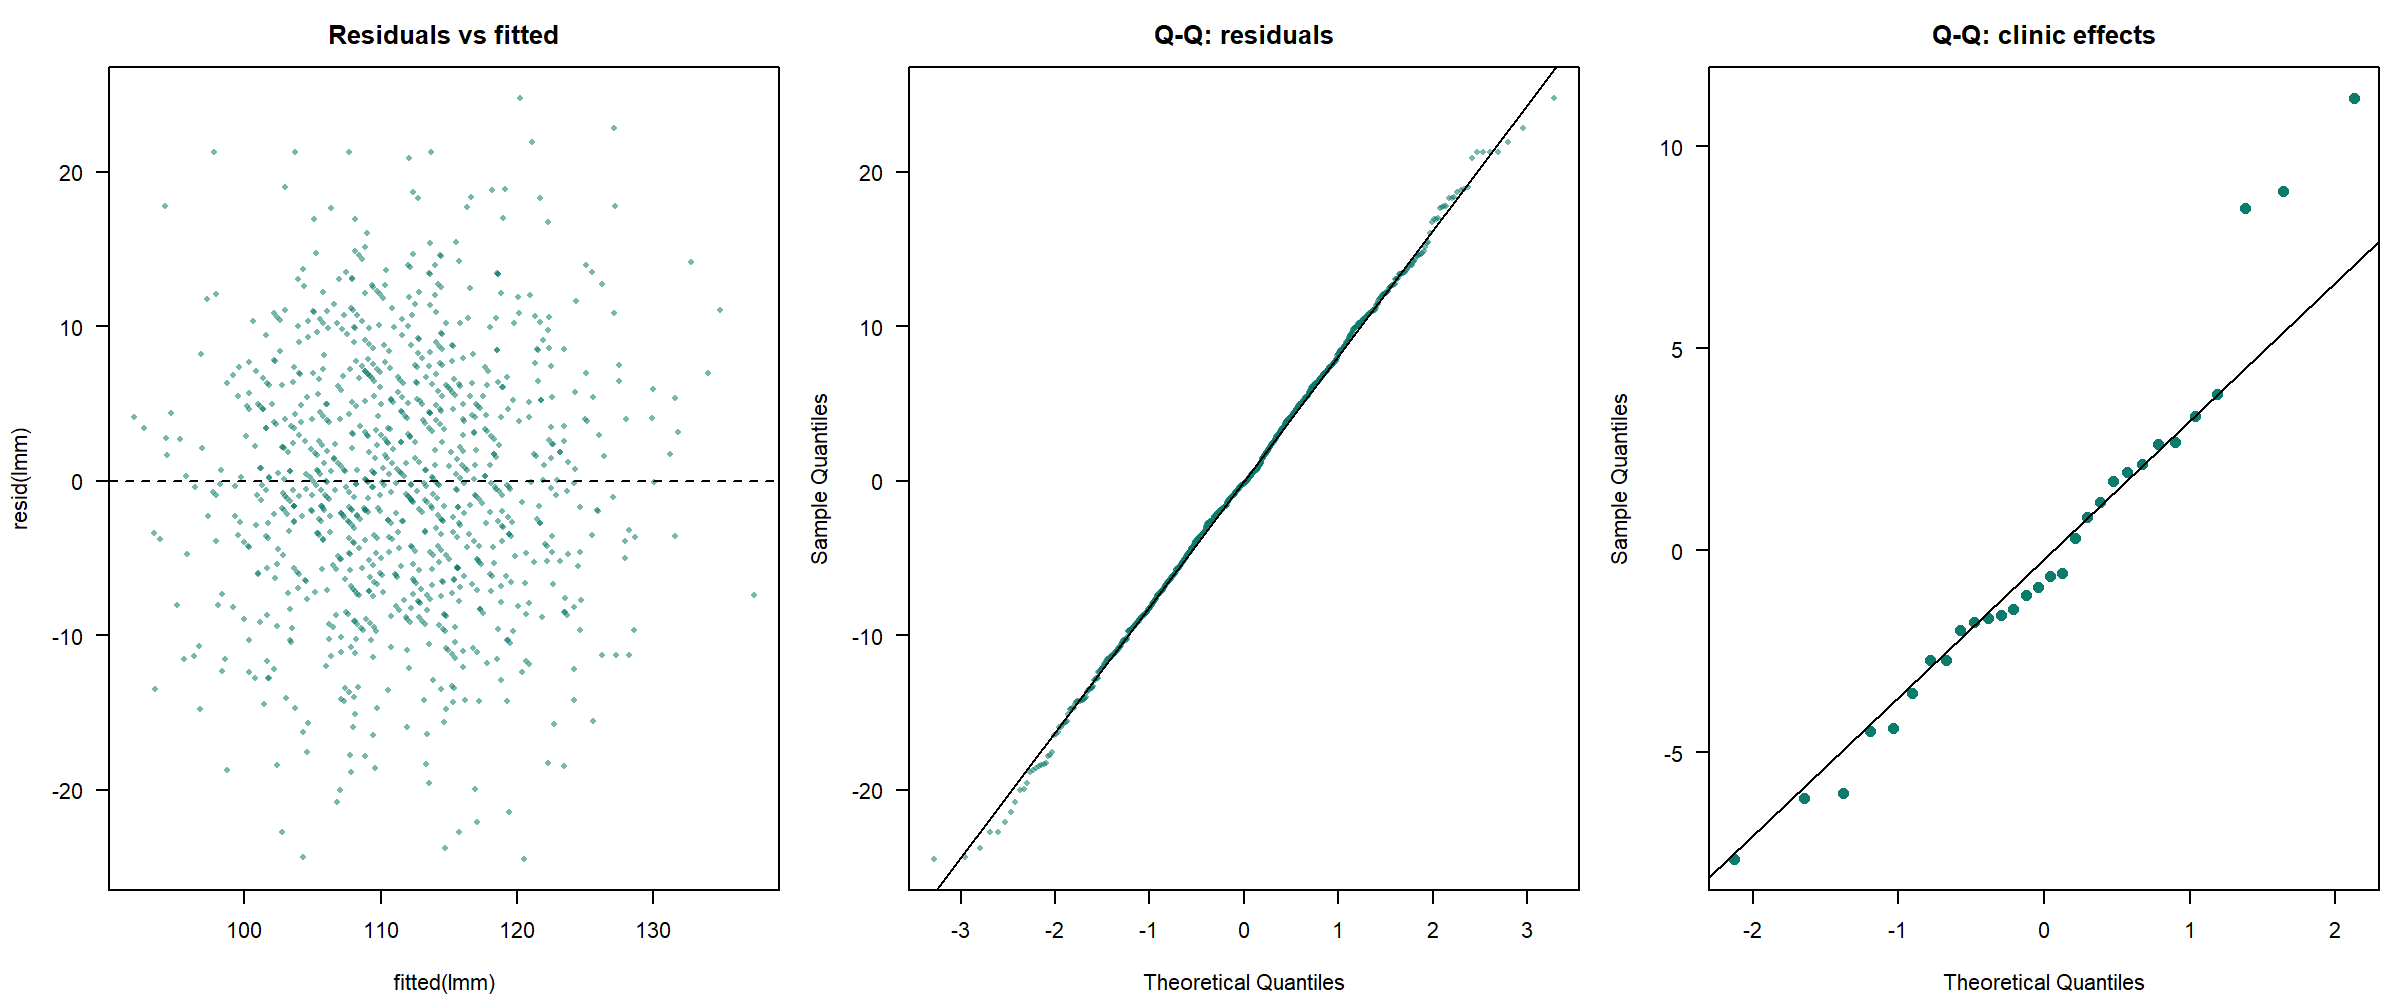
The three plots check linearity and equal variance (residuals against fitted values), normal residuals (Q-Q plot of the residuals) and normal clinic effects (Q-Q plot of the 30 clinic shifts, where three clinics lie above the line). isSingular() returns FALSE, so the clinic variance was estimated without problems.
lmm_rs <- lmer(sbp ~ age + female + smoker + clinic_urban + (age | clinic_id),
data = clinics)A random slope, (age | clinic_id), gives each clinic its own age slope as well as its own baseline. R prints a message about a boundary (singular) fit; question 3 asks what it means.
R Reflect on what you just ran
Answer each question from your own output, as on the final exam: find the number, say what it means, judge the check.
1. Interpret the fixed effect for clinic_urbanurban with its 95% confidence interval, saying which patients it compares. Then explain what the estimated shift of 11.2 for clinic 1 means for the patients of that clinic.
2. Interpret the adjusted ICC that line 24 prints (vc$vcov[1] / sum(vc$vcov), 0.24) in plain words. The model with no predictors (Activity 5.1) had a clinic variance of 22.10, a residual variance of 104.34 and an ICC of 0.175. Use the two variances of each model, which line 23 prints, to explain why the adjusted ICC is larger.
3. Run your own code: at the end of the script, type VarCorr(lmm_rs) and fixef(lmm_rs) and run them. First, name two checks you ran on lmm and say what your output shows for them. Then explain what the random slope for age in lmm_rs would let the model describe, and what the message from line 37, the VarCorr() output and the fixed effects suggest you should do.
isSingular(lmm) is FALSE, so the clinic variance was estimated and the random intercept is supported. The random slope (age | clinic_id) would let the association between age and blood pressure differ from clinic to clinic, which suits a question about how an effect varies between settings. R reports a boundary (singular) fit, and VarCorr(lmm_rs) shows a standard deviation of only 0.014 for the age slopes and a correlation of −1.000, so the random part of the model is more complex than 30 clinics can support. Report the random-intercept model and state that a random slope for age could not be estimated; the fixed effects barely change (smoking 5.00 in both models), so the conclusion does not depend on the random slope.Your output from Activity 5.2 shows the fixed effects, the adjusted ICC and the model checks interpreted in this section, together with the singular fit that a random slope produces with 30 clinics. The key takeaways below draw the section together before its knowledge check.
Key Takeaways
- 4.1 A random-intercept model is a regression in which each cluster gets its own baseline. In
lmer()you add the term(1 | clinic_id), where the 1 stands for the intercept and the bar can be read as "for each", so the term means "an intercept for each clinic". Each clinic's intercept is the overall intercept plus a shift for that clinic, and rather than estimating 30 separate shifts, the model treats them as a random sample from a normal distribution and summarises them with one variance. This is how it differs from an ordinary regression, which has a single intercept and treats every patient as independent: the mixed model allows for the clustering and can still estimate a clinic-level predictor such asclinic_urban, with a standard error that reflects the 30 clinics. If a question asks what(1 | cluster)adds, say that it gives each cluster its own baseline and allows for the fact that people in the same cluster are alike. - 4.2 The fixed effects of a mixed model are read just like the coefficients of an ordinary linear regression: each is a difference in the average outcome between people with the same values of the other predictors in the same cluster. For example, the coefficient of 5.00 for
smokerYesmeans that smokers have an average systolic blood pressure 5.0 mmHg higher than non-smokers of the same age and gender attending the same clinic (95% CI 3.63 to 6.37). An estimated cluster shift is read for the whole cluster: patients of a clinic with a shift of +8 mmHg average about 8 mmHg higher than similar patients in an average clinic, a difference that the predictors in the model do not explain. Because everyone in a clinic shares its shift, it raises every prediction for that clinic by the same amount but leaves the difference between two of its patients unchanged, as Worked Example 5.2 shows. In your own interpretations, say which people are being compared, give the units and the confidence interval, and if the interval for a cluster-level predictor includes 0, say that the data cannot tell the groups apart. - 4.3 The random-effects block of
summary()gives two variances: the variance between clusters (theclinic_id (Intercept)row, 21.57) and the residual variance among people within a cluster (theResidualrow, 68.94). Their square roots, the standard deviations (4.64 and 8.30 mmHg), are in the units of the outcome, which makes them easier to picture. The adjusted ICC comes from the same line of R code as before,vc$vcov[1] / sum(vc$vcov), which prints 0.24 (the clinic share of 21.57 + 68.94), and describes the clustering that remains once the predictors are in the model. It can be larger or smaller than the ICC from the model with no predictors: here age, gender and smoking explained much of the variation among patients within clinics (the residual variance fell from about 104 to 69) but little of the variation between clinics (about 22 in both models), so the ICC rose from 0.175 to 0.24, whereas a strong cluster-level predictor can shrink the cluster variance and lower the ICC. To explain any change in the ICC, look at which of the two variances fell and by how much. - 5.1 Before you trust a mixed model, run a short set of checks, and in an exam be ready to name them and say what a problem would look like. A plot of residuals against fitted values should be a flat, even cloud (linearity and equal variance), and a Q-Q plot of the residuals should follow the line (normal residuals). A Q-Q plot of the cluster effects from
ranef()checks that the cluster shifts are roughly normal; it is rough with few clusters, and a few clusters off the line, like the three high clinics in Figure 5.5, are worth reporting and investigating rather than a reason to abandon the model. You also need enough clusters, about 20 to 30 or more (thegroupsline of the output ornlevels()tells you how many), clusters that are independent by design, andisSingular()returningFALSE, which means the cluster variance was estimated rather than collapsing to zero. When an output reports one of these checks, say what it shows and whether the model is acceptable, rather than only naming the check. - 5.2 A random slope lets the effect of a predictor, and not only the baseline, differ from cluster to cluster. In
lmer(),(age | clinic_id)gives each clinic its own intercept and its own age slope, which suits research questions about how an effect varies between settings, such as whether a program works better in some schools than in others. Random slopes need more clusters and more observations per cluster, so with about 30 clusters they often produce a warning. A convergence warning means that R stopped before it was sure it had found the best estimates, and a singular fit means that a variance was estimated at or near zero (or a correlation at exactly ±1); both say that the random part of the model is more complex than the data can support. The sensible response, and the one exam answers look for, is to report the simpler random-intercept model, state that a random slope could not be estimated, and note that if the main fixed effect is almost the same in both models, the conclusion does not depend on the random slope.
1. A study of 1,020 residents in 34 long-term care homes fits lmer(qol ~ age10 + dementia + therapist + (1 | home_id)), where qol is a quality-of-life score and therapist records whether the home employs a recreation therapist. The fixed effect for dementia is −3.1 points, and the estimated shift (random effect) for home H07 is +4.0 points. Which statement is correct?
(1 | home_id), read as “an intercept for each home”, and H07's estimated shift. The shift moves every prediction for H07 up by 4 points, so it cancels out of any comparison between two residents of H07 and the dementia difference stays −3.1; it describes a difference between homes that the predictors do not explain, not the effect of a measured variable such as the therapist, which has its own coefficient. The option that adds 4.0 to the dementia effect confuses a random intercept with a random slope, which would be written (dementia | home_id). (Section 2, 4.1 The Random-Intercept Model and Equation 5.3, and 4.2 Interpreting the Fixed Effects and Cluster Shifts with Worked Example 5.2; Objectives 4.1 and 4.2)2. The fixed effects of the care-home model are shown below. Seventeen of the 34 homes employ a recreation therapist, and the homes chose this themselves. Which is the best interpretation of the therapist coefficient?
| Fixed effect | Estimate | 95% CI | p-value |
|---|---|---|---|
| Age, per 10 years | −0.9 | −1.3 to −0.5 | < 0.001 |
| Dementia | −3.1 | −4.0 to −2.2 | < 0.001 |
| Recreation therapist | 2.4 | −0.5 to 5.3 | 0.12 |
3. In the care-home study, the model with no predictors gave a home variance of 9.0, a residual variance of 66.0 and an ICC of 0.12. For the model with age, dementia and therapist, the analyst obtained the variances and the adjusted ICC in R as shown below. What does the adjusted ICC mean, and why does it differ from 0.12?
4. The analyst checks the care-home model and reports: the plot of residuals against fitted values is a flat cloud with an even spread; the Q-Q plot of the residuals follows the line; the Q-Q plot of the 34 home effects follows the line except for one home well above it; nlevels(home_id) is 34; and isSingular(model) returns FALSE. What should the analyst conclude?
isSingular() should return FALSE, which means the home variance was not estimated as zero. One home above the line is a mild departure from normal cluster effects, and fixed effects are not very sensitive to it, so it is reported and the home examined rather than the model discarded. The option about isSingular() reverses the meaning of the check. (Section 2, 5.1 Checking a Linear Mixed Model, Table 5.5 and Figure 5.5; Objective 5.1)5. To ask whether the dementia difference varies between homes, the analyst fits lmer(qol ~ age10 + dementia + therapist + (dementia | home_id)). R prints “boundary (singular) fit”, and the dementia estimate is almost unchanged (−3.0 against −3.1). Which statement is correct?
(dementia | home_id) adds (each home gets its own dementia slope as well as its own baseline, which suits a question about how an effect varies between settings) and what the message means. A singular fit says that the random part of the model is more complex than the data can support, so a variance sits at or near zero (or a correlation at ±1); because the dementia estimate barely changes, the conclusion does not depend on the random slope. The tempting reading that the dementia difference is identical in every home is wrong: a variance estimated at zero shows that 34 homes cannot measure the variation, not that there is none. (Section 2, 5.2 Random Slopes and Model Warnings; Objective 5.2)6. A researcher studies body mass index (BMI) among 1,200 employees of 15 workplaces. Seven of the workplaces have an on-site cafeteria that serves subsidised healthy meals (cafeteria = 1), a characteristic of the workplace. The model m1 <- lmer(bmi ~ age10 + female + cafeteria + (1 | workplace), data = staff) gives the output below. What do these lines show?
isSingular() returning FALSE means that the workplace variance was not estimated as zero, while nlevels() counts the clusters, and about 20 to 30 is a common minimum because the cluster variance is estimated from the clusters themselves. The cafeteria is a workplace-level predictor, so its information comes from the 15 workplaces, which is why the df column shows about 12 rather than about 1,200, just as urban clinic had about 28 for 30 clinics. The number of employees does not make up for few clusters, and passing the singular-fit check does not show that there are enough of them. (Section 2, 4.2 Interpreting the Fixed Effects and Cluster Shifts (the df column), 5.1 Checking a Linear Mixed Model, Table 5.5 and the slide “Enough clusters, and no singular fit”; Objective 5.1)Binary Outcomes: Mixed Models and GEE
Smoking barely changes; urban clinic does
Overview
This section extends logistic regression to clustered data. The outcome is referred, which records whether each of the 966 patients in phaa_clinics.csv was referred to a specialist (246 were, as table(clinics$referred) in Activity 5.3 shows). The predictors are age, smoking and urban clinic. A generalized linear mixed model (GLMM) and a generalized estimating equations (GEE) model are fitted and compared with an ordinary logistic regression. The two approaches allow for clustering in different ways and estimate slightly different odds ratios, so the section also explains what each kind of odds ratio means, how to choose between the approaches for a given research question, and how each is checked.
Learning Objectives
- 6.1 Describe how a logistic GLMM (
glmer()) and a logistic GEE model (geeglm()) each allow for clustering. - 6.2 Interpret odds ratios from both models and compare their standard errors with an ordinary logistic regression.
- 6.3 Distinguish clinic-specific (conditional) from population-averaged (marginal) odds ratios in plain language.
- 6.4 Choose between a GLMM and GEE using the research question and the number of clusters.
- 6.5 List the checks for each approach.
6.1 How a GLMM and GEE Allow for Clustering
Logistic regression can allow for clustering in two ways, which correspond to the two families of methods introduced in Section 1 and listed in Table 5.3. A GLMM gives each clinic its own baseline log-odds, and GEE fits one model for the whole population and calculates standard errors that allow for the clustering.
A generalized linear mixed model (GLMM) adds random effects to a generalized linear model. For a binary outcome, it is a logistic regression in which each clinic has its own baseline log-odds, with the clinic shifts drawn from a normal distribution, just as in the linear mixed model of Section 2. It is fitted with glmer() from lme4, which takes the same family = binomial argument as glm(), and the random intercept (1 | clinic_id) goes inside the model formula. Equation 5.4 writes the GLMM for referral in the clinic data.
Generalized estimating equations (GEE) take a different approach. They fit a logistic regression without clinic effects, so no clinic is given its own baseline. Instead, GEE deals with the clustering in two steps. First, a working correlation describes how alike patients in the same clinic are assumed to be, and GEE uses it to weight the data. By this we mean that if patients in the same clinic are assumed to be correlated, each additional patient from a clinic is treated as adding a little less new information, so the patients of a large clinic count for slightly less each. Second, the standard errors are calculated from how much the data actually vary from clinic to clinic, using the totals of the residuals within each clinic, rather than from the variance the model assumes. Because these standard errors are built from the clinics, they allow for the clustering (Zeger & Liang, 1986). The analyst chooses the working correlation structure. For people in clinics, schools or households, the usual choice is "exchangeable", which assumes that any two members of a cluster are equally correlated. These corrected standard errors are called sandwich (or robust) standard errors, after the shape of the formula used to calculate them. Their key strength is that they remain valid even if the working correlation is not exactly right, provided there are enough clusters, because they rely on the variation observed between clusters rather than on the assumed correlation. GEE is fitted with geeglm() from geepack, which needs the cluster identifier in the id argument rather than in the formula, and the data sorted so that each cluster's rows are together.
In short, the GLMM allows for clustering with a random intercept and GEE with sandwich standard errors. The next part fits both models to the referral data and compares their results with an ordinary logistic regression.
6.2 Odds Ratios and Standard Errors from the Three Models
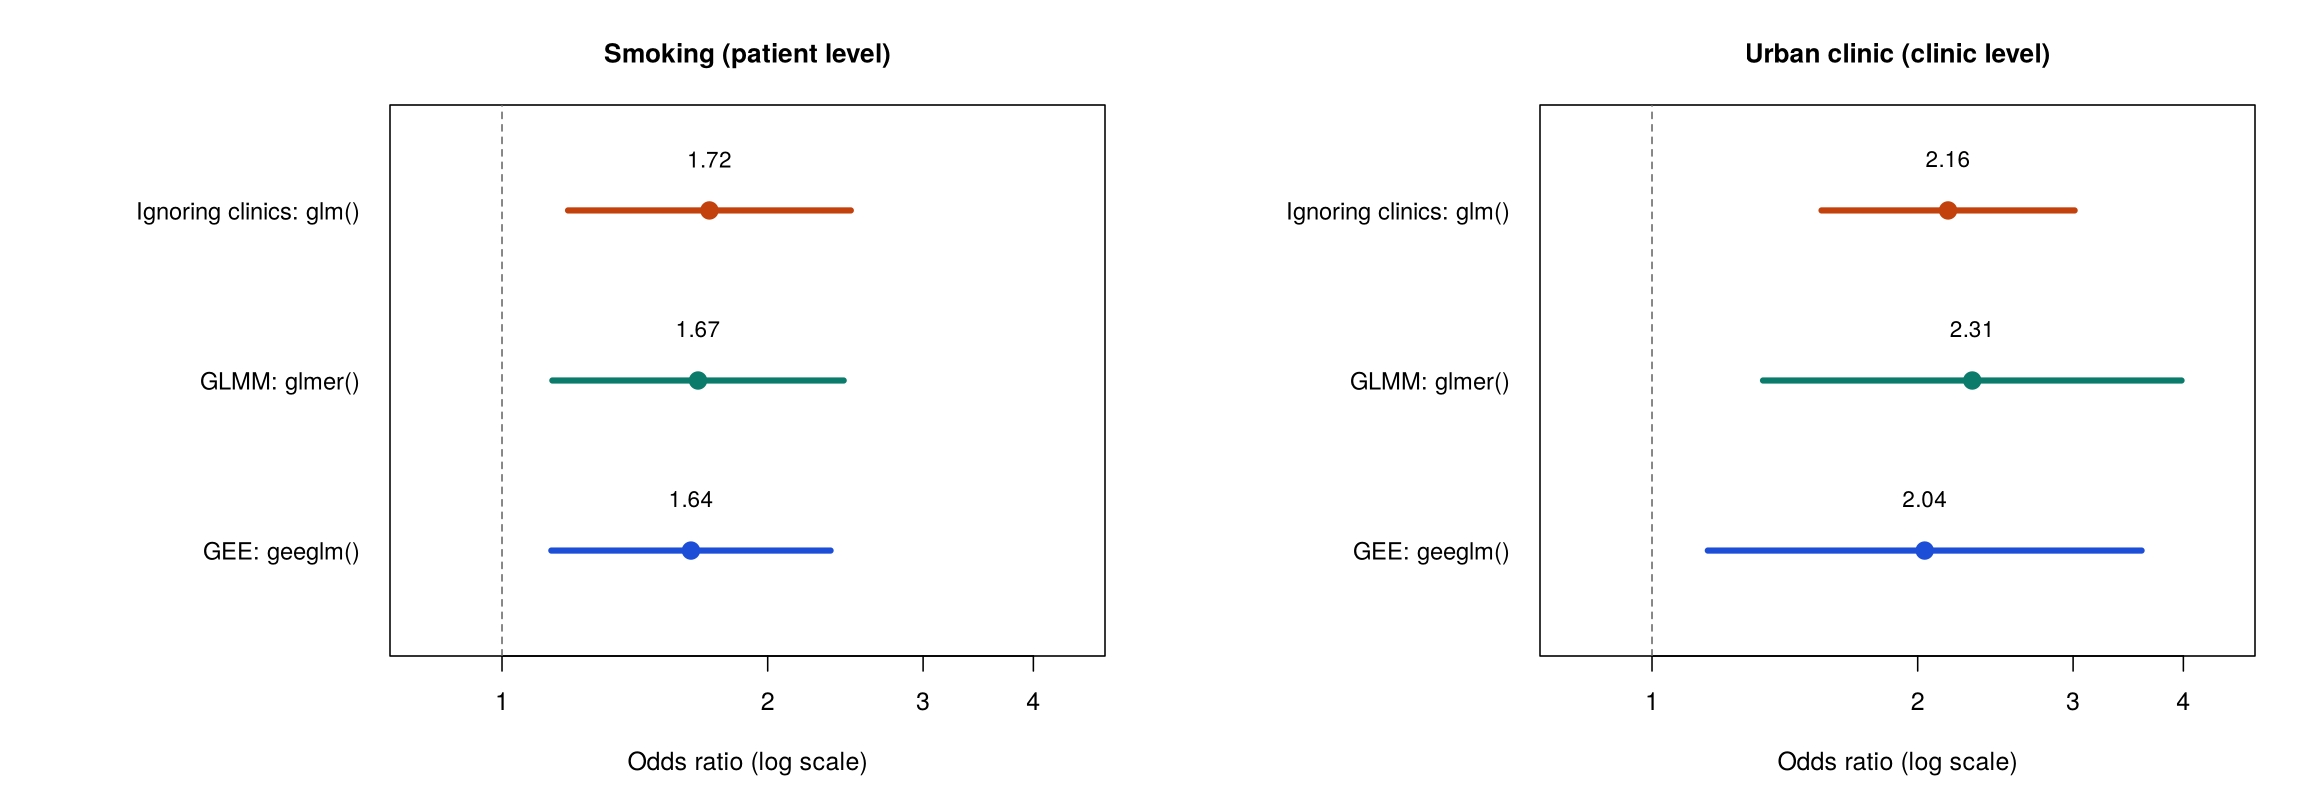
Activity 5.3 at the end of this section fits an ordinary logistic regression (glm()), a GLMM (glmer()) and GEE (geeglm()) with the same three predictors. Odds ratios from both clustered models are obtained and read as in ordinary logistic regression, by exponentiating the coefficients with exp(fixef(glmm)) or exp(coef(gee)). Table 5.6 shows the odds ratios for smoking (a patient-level predictor) and urban clinic (a clinic-level predictor), with their standard errors on the log-odds scale.
Table 5.6. Odds ratios for smoking and urban clinic, with standard errors on the log-odds scale, from three models of specialist referral.
| Model | OR for smoking | SE (smoking) | OR for urban clinic | SE (urban clinic) |
|---|---|---|---|---|
Ordinary logistic regression, glm() | 1.72 | 0.188 | 2.16 | 0.168 |
GLMM, glmer() | 1.67 | 0.194 | 2.31 | 0.279 |
GEE, geeglm() | 1.64 | 0.186 | 2.04 | 0.289 |
Figure 5.6 plots the same odds ratios with their 95% confidence intervals.
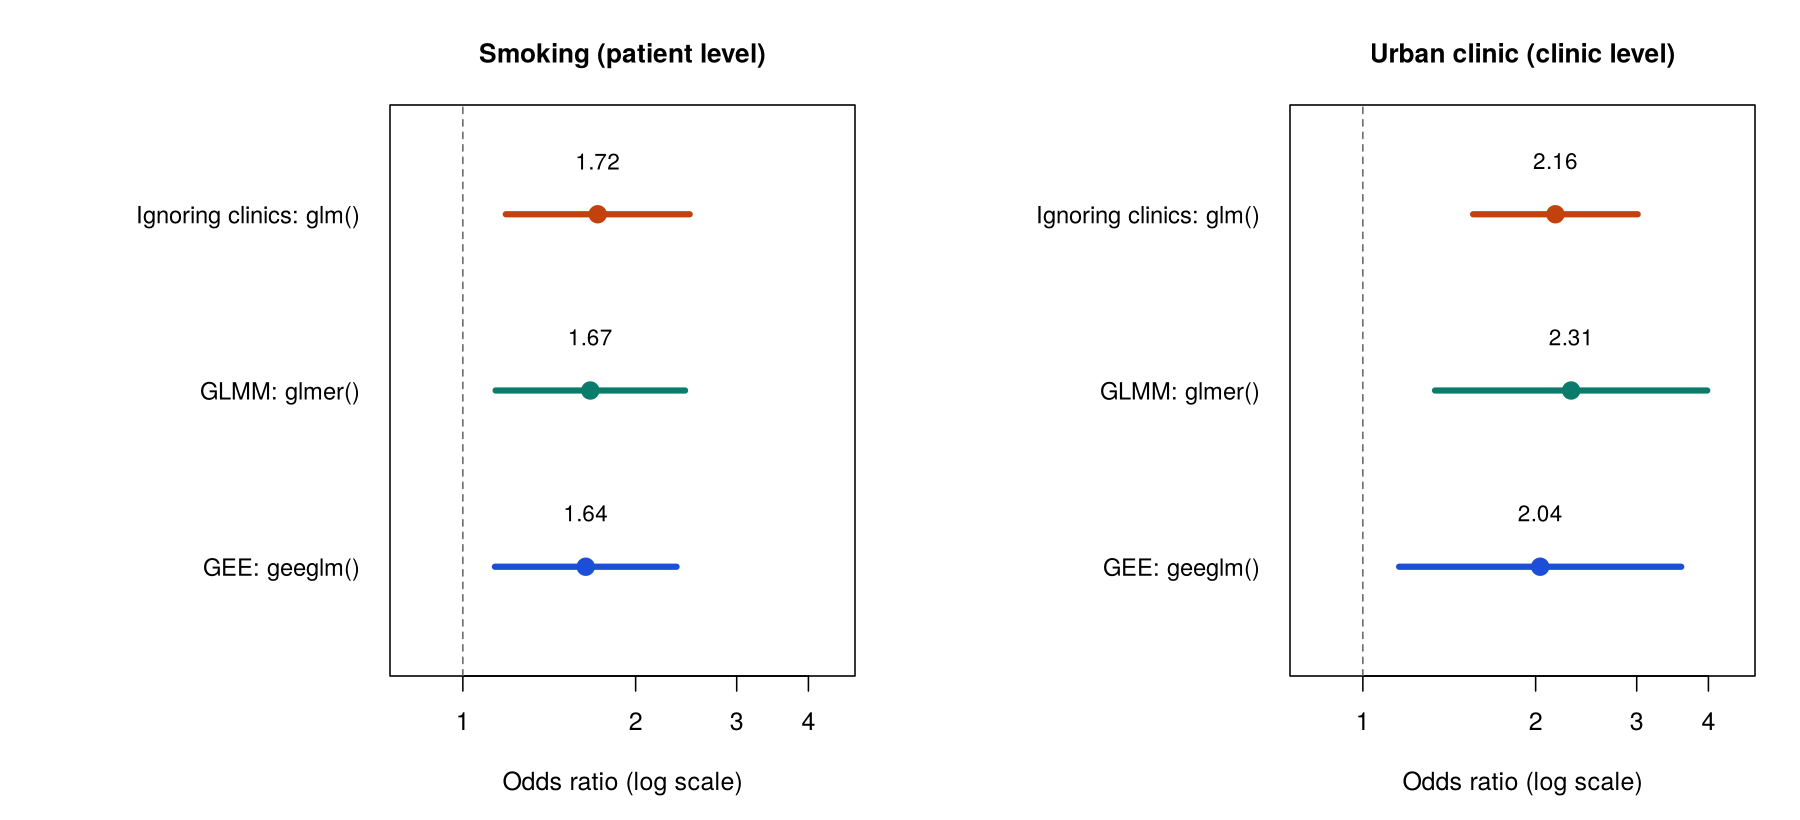
For smoking, the three models give similar odds ratios and standard errors, because smokers and non-smokers are found in every clinic and the comparison can be made within clinics. For urban clinic, the standard error rises from 0.168 in the ordinary logistic regression to 0.279 in the GLMM and 0.289 in GEE. This is the same pattern as for blood pressure in Section 1, with the same explanation: urban clinic has only 30 independent values, whereas smoking can be compared within every clinic. The odds ratio remains clearly above 1 in all three models: patients in urban clinics have about twice the odds of referral of patients in rural clinics of the same age and smoking status (GLMM OR 2.31, p = 0.003; GEE OR 2.04, p = 0.014).
The GEE odds ratio for urban clinics (2.04) is a little lower than the glm() odds ratio (2.16) because the exchangeable working correlation gives each patient in a large clinic slightly less weight. This happens because, when patients in a clinic are assumed to be correlated, the 45th patient from a clinic adds less new information than the first, so large clinics influence the estimate a little less than they do in glm(), which counts every patient equally. As a result, the balance of urban and rural clinics in the estimate shifts slightly, and the odds ratio moves with it. Refitting GEE with corstr = "independence" reproduces the glm() odds ratio of 2.16, with the corrected standard error of 0.289.
Both clustered models therefore widen the standard error of the clinic-level predictor and agree that urban clinics have about twice the odds of referral. Their odds ratios still differ (2.31 against 2.04), because they answer slightly different questions, which the next part explains.
6.3 Clinic-Specific and Population-Averaged Odds Ratios
A GLMM odds ratio is clinic-specific, or conditional: it compares two patients in the same clinic, or in clinics with the same baseline, so the GLMM's 2.31 compares similar patients in an urban and a rural clinic with the same baseline. By this we mean that the clinic's own baseline is held fixed, and the odds ratio compares the odds of referral in an urban and a rural clinic for patients whose clinic baselines are the same. A GEE odds ratio is population-averaged, or marginal: it compares all urban-clinic patients with all rural-clinic patients of the same age and smoking status, across every clinic. In this case the clinic baselines are not held fixed; instead, the proportion referred is averaged over all the clinics, with their high and low baselines mixed together, before the two groups are compared. The two kinds of odds ratio therefore answer different questions. The first is about the comparison within a clinic, and the second is about the difference that would be seen in the population as a whole. Because odds ratios do not average in a simple way, these two questions generally have different answers whenever the clinics differ in their baselines, as Worked Example 5.3 shows. An interpretation of either odds ratio should name which kind it is, for example by beginning "for two patients in the same clinic" for a GLMM result and "across the whole population, averaging over clinics" for a GEE result. Click each of the cards below to compare the two kinds of odds ratio and the questions they answer, and to review the working correlation that GEE uses.
Worked Example 5.3 explains why the GLMM odds ratio for urban clinics in Table 5.6 is further from 1 than the GEE odds ratio. Watch how averaging over clinics with different baselines changes the comparison.
Worked Example 5.3: Why the GLMM Odds Ratio Is Further From 1
Suppose that a patient in an urban clinic has 2.3 times the odds of referral of a similar patient in a rural clinic with the same baseline. Clinics also differ in their baseline odds, so the population of urban patients mixes clinics with high and low baselines, and so does the population of rural patients. Averaging the probability of referral over this mix pulls the population comparison toward 1, so the population-averaged odds ratio is smaller than the clinic-specific odds ratio. The reason is that the same odds ratio produces different gaps in probability at different baselines. In a clinic where almost no one is referred, or almost everyone is, multiplying the odds by 2.3 moves the probability of referral only a little, whereas in a clinic with a middling baseline it moves the probability a lot. When the probabilities from all of these clinics are averaged together, the small gaps dilute the large ones, and the resulting population comparison, expressed as an odds ratio, is closer to 1 than the clinic-specific odds ratio. Averaging over clinics is one reason the GEE odds ratio (2.04 here) is smaller than the GLMM odds ratio (2.31), and the weighting used by GEE and chance variation also contribute in this sample. The larger the variation between clinics, the larger the gap. For a continuous outcome with an identity link, averaging does not change the difference, so the two kinds of estimate are the same.
Neither model is wrong when the two odds ratios differ: each answers a valid question, and the gap reflects how much the clinics vary. Which question matters depends on who is asking, which is the basis for choosing between the two approaches.
6.4 Choosing Between a GLMM and GEE
The choice depends mainly on the research question (Subramanian & O'Malley, 2010). A GLMM suits questions about individual clusters, estimates how much the clusters vary, and works with fewer clusters. GEE suits questions about the population as a whole and makes no assumption about the distribution of cluster effects (Hubbard et al., 2010), but it needs more clusters for reliable standard errors (Hemming & Taljaard, 2023). Published rules of thumb for the number of clusters vary. This lesson uses about 20 to 30 clusters for a mixed model and about 30 to 40 or more for GEE as working values, while Hemming and Taljaard advise a small-sample correction whenever a GLMM has fewer than about 40 clusters or a GEE analysis fewer than about 50. The need for more clusters follows from how GEE works: because its sandwich standard errors are calculated from the variation observed between clusters, each cluster acts as one piece of evidence about that variation, and with only a few clusters the standard errors themselves are estimated imprecisely and tend to be too small. For example, a clinic manager asking how much higher the odds of referral are for a patient in her own clinic needs the GLMM's clinic-specific odds ratio, while a provincial planner asking how referral differs across the province needs the GEE population-averaged odds ratio. The number of clusters then has to be checked: a GLMM works with about 20 to 30 clusters, while GEE needs about 30 to 40 or more, so the 30 clinics here meet the GLMM requirement and sit at the lower limit for GEE. In practice, many epidemiological papers report one approach as the main analysis and the other as a sensitivity analysis. When they agree, as they do for urban clinics here, the conclusion is stronger.
Whichever approach is chosen, its result rests on assumptions that need to be checked before it is reported, as the next part sets out.
6.5 Checking a GLMM and GEE
The GLMM and GEE share some assumptions and differ in others, including the number of clusters each needs. Table 5.7 lists the assumptions of each approach with how to check them.
Table 5.7. Assumptions of the logistic GLMM and GEE, with how to check them.
| Assumption | GLMM | GEE | How to check it |
|---|---|---|---|
| Binary outcome with enough events | Required | Required | table(outcome); about 10 events per predictor (246 events here). |
| Independent clusters | Required | Required | Judged from the study design. |
| Enough clusters | About 20 to 30 | About 30 to 40 or more | nlevels(clinic_id); 30 clinics here, at the lower limit for GEE. |
| Normal cluster effects (log-odds scale) | Assumed | Not assumed | Q-Q plot of ranef(model). |
| Model fitted without problems | Read any convergence warnings | Correct id, data sorted by cluster | Warnings in the console; the "Number of clusters" line in the GEE output. |
GEE has no clinic effects, so the Q-Q plot of the cluster effects is a check for the GLMM only. GEE instead requires one step before the model is fitted, and forgetting it is a common and silent error, as the caution below explains.
Sort the Data Before Using geeglm()
geeglm() treats consecutive rows with the same id as one cluster. If the rows of a clinic are scattered through the file, the function splits that clinic into several clusters and the standard errors are wrong without any warning. Sorting the data by the cluster identifier (and by time for repeated measures) before fitting avoids the problem. The line Number of clusters: 30 in the output confirms that the clinics were read correctly.
A GLMM and GEE therefore both allow for clustering in a binary outcome, widen the standard error for the clinic-level predictor and reach the same conclusion for urban clinics, while answering clinic-specific and population-averaged questions respectively. Activity 5.3 lets you fit the three models in Table 5.6 in R, compare them and see what happens when the data are not sorted: run the script and answer the questions from your own output. Section 4 then applies a linear mixed model and GEE to repeated measurements of the same people.
Text version of the activity: the code of the run-along script, its console output and notes on reading it.
library(lme4); library(geepack)   # glmer() for the GLMM, geeglm() for GEE
clinics <- read.csv("https://heal-learn.ca/r-activities/data/phaa_clinics.csv")   # course data, read from the website
clinics$clinic_id <- factor(clinics$clinic_id)
clinics$smoker <- factor(clinics$smoker, levels = c("No", "Yes"))   # "No" = reference
clinics$clinic_urban <- factor(clinics$clinic_urban, levels = c("rural", "urban"))
table(clinics$referred)        # 1 = referred: how many events?
nlevels(clinics$clinic_id) # how many clusters?The two checks before fitting: 246 of the 966 patients were referred, far more than the guide of about 10 events per predictor for three predictors, and there are 30 clinics, enough for a GLMM (about 20 to 30 clusters) and at the lower limit for GEE (about 30 to 40 or more).
naive <- glm(referred ~ age + smoker + clinic_urban, family = binomial, data = clinics)The ordinary logistic regression treats the 966 patients as independent. Its odds ratios and standard errors appear in the comparison at the end of the activity.
glmm <- glmer(referred ~ age + smoker + clinic_urban + (1 | clinic_id),
              family = binomial, data = clinics)
summary(glmm)
round(exp(cbind(OR = fixef(glmm), confint(glmm, parm = "beta_", method = "Wald"))), 3)Reading the output. In the GLMM, the Random effects block gives a clinic variance of 0.30 on the log-odds scale (standard deviation 0.55), so clinics differ in their baseline odds of referral. The Fixed effects block is read like a logistic regression: each coefficient is a log odds ratio for patients in the same clinic or, for urban clinic, in clinics with the same baseline. The urban-clinic coefficient is 0.836 (SE 0.279, p = 0.003), and the last line prints its odds ratio, 2.31 (95% CI 1.34 to 3.98): a clinic-specific (conditional) odds ratio.
clinics <- clinics[order(clinics$clinic_id), ]   # each clinic's rows together
gee <- geeglm(referred ~ age + smoker + clinic_urban, id = clinic_id,
              family = binomial, corstr = "exchangeable", data = clinics)
summary(gee)
round(exp(cbind(OR = coef(gee), confint.default(gee))), 3)The GEE output gives population-averaged coefficients with corrected (sandwich) standard errors in the Std.err column and Wald tests in the next two columns. The urban-clinic coefficient is 0.711 (SE 0.289, p = 0.014), an odds ratio of 2.04 (95% CI 1.16 to 3.59): a population-averaged (marginal) odds ratio. The estimated exchangeable correlation (alpha) is 0.04, and the line Number of clusters: 30 confirms that the sorted data were read as 30 clinics. The Estimated Scale Parameters block can be ignored. Printing summary() of a GEE model also lowers the number of digits R prints for the rest of the session, which is why later output is shorter.
or_se <- function(fit, x) {
  b <- summary(fit)$coefficients[x, 1:2]   # estimate and its SE
  c(OR = exp(b[[1]]), SE = b[[2]])
}
three <- function(x) rbind(glm = or_se(naive, x), glmer = or_se(glmm, x), geeglm = or_se(gee, x))
round(three("smokerYes"), 3)           # a patient-level predictor
round(three("clinic_urbanurban"), 3) # a clinic-level predictorFor smoking, a patient-level predictor, the three models give similar odds ratios and standard errors (0.188, 0.194 and 0.186). For urban clinic, a clinic-level predictor, the odds ratio is about 2 in all three models, but its standard error rises from 0.168 when the clinics are ignored to 0.279 (GLMM) and 0.289 (GEE).
R Reflect on what you just ran
Answer each question from your own output, as on the final exam: interpret each odds ratio and say what kind it is, explain the standard errors, and judge the checks before you choose a result to report.
1. Interpret the odds ratio for clinic_urbanurban from the GLMM and from GEE, each with its 95% confidence interval, stating what kind of odds ratio each one is. Why is the GLMM odds ratio further from 1?
2. Compare the standard errors for smokerYes and for clinic_urbanurban across the three models. Why does one change much more than the other, and which results should be reported?
glm() to 0.279 in the GLMM and 0.289 in GEE, while for smoking it stays almost the same (0.188, 0.194 and 0.186). Urban clinic is a clinic-level predictor: it takes one value per clinic, so the 966 patients supply only 30 independent values of it, and glm(), which treats every patient as independent, gives it a standard error, confidence interval and p-value that are too small (overconfident). Smoking varies among patients within every clinic, so its information comes from comparisons within clinics, and allowing for the clinics changes its standard error little. The GLMM (a random intercept for each clinic) and GEE (sandwich standard errors calculated from the variation between clinics) both allow for the clustering, so one of them should be reported, not glm().3. Run your own code: at the end of the script, type shuffled <- clinics[order(clinics$age), ] and summary(update(gee, data = shuffled)) and run them. What does the Number of clusters line show now, and what happens to the standard error for clinic_urbanurban? Why must the data be sorted before geeglm(), and are 30 clinics enough for GEE? Which odds ratio for urban clinic would you give a clinic manager asking about patients in her own clinic, and which a provincial planner asking about the whole province?
Number of clusters: 705 instead of 30, because geeglm() treats consecutive rows with the same id as one cluster, so the scattered rows of each clinic were split into many small clusters. Its standard error for urban clinic falls to 0.171, close to the glm() value of 0.168, so the clustering is no longer allowed for, and R gives no warning. Sorting the data by clinic before fitting keeps each clinic's rows together, and the line Number of clusters: 30 in the sorted model confirms that the 30 clinics were read correctly. GEE needs about 30 to 40 clusters or more for reliable sandwich standard errors, so 30 clinics is just enough, at the lower limit; the agreement with the GLMM is reassuring. A clinic manager would get the GLMM (clinic-specific) odds ratio, 2.31, which compares patients within a clinic, and a provincial planner the GEE (population-averaged) odds ratio, 2.04, which describes the association across all patients in the province.Your output from Activity 5.3 shows both clustered models widening the standard error for urban clinics, and the unsorted refit shows why the data must be sorted before GEE is fitted. The key takeaways below draw the section together before its knowledge check.
Key Takeaways
- 6.1 A GLMM and GEE both extend logistic regression to clustered data, but they allow for the clustering in different ways. A GLMM, fitted with
glmer(..., family = binomial), works like the linear mixed model: a random intercept such as(1 | clinic_id)gives each cluster its own baseline log-odds, with the shifts drawn from a normal distribution. GEE, fitted withgeeglm(), fits one logistic regression for the whole population with no cluster effects, uses a working correlation (usually"exchangeable", which assumes that any two members of a cluster are equally correlated) to weight the data, and calculates corrected, or sandwich, standard errors from the variation between clusters. You can tell them apart in code because the GLMM puts the cluster inside the formula, while GEE names it in theidargument. If a question asks how each method allows for clustering, the short answer is a random intercept for the GLMM and sandwich standard errors for GEE. - 6.2 Odds ratios from both models are read as you read them from ordinary logistic regression: R gives them with
exp(fixef(glmm))orexp(coef(gee))(2.31 for urban clinics in the GLMM, the exponentiated coefficient of 0.836), and you describe the change in the odds, for example that patients in urban clinics have about twice the odds of referral of patients in rural clinics of the same age and smoking status. Compared with an ordinaryglm(), both methods widen the standard error of a cluster-level predictor (0.168 for urban clinic rising to 0.279 in the GLMM and 0.289 in GEE, clearly larger), while the standard error of a person-level predictor such as smoking hardly changes (0.188, 0.194 and 0.186). This is the same pattern you met for blood pressure in Section 1, and it has the same explanation: urban clinic has only 30 independent values, whereas smoking can be compared within every clinic. Whenever you interpret one of these odds ratios, give its confidence interval, check whether the interval includes 1, and say whether the odds ratio is cluster-specific or population-averaged. - 6.3 The two models answer slightly different questions, so an exam answer should always name the kind of odds ratio it reports. A GLMM odds ratio is cluster-specific (conditional): it compares two people in the same cluster, or in clusters with the same baseline, so the GLMM's 2.31 compares similar patients in an urban and a rural clinic with the same baseline. A GEE odds ratio is population-averaged (marginal): it compares all urban-clinic patients with all rural-clinic patients of the same age and smoking status, across every clinic. For a binary outcome, averaging over clusters with high and low baselines pulls the population comparison toward 1, so the GEE odds ratio is usually a little closer to 1 (2.04 against 2.31), and the gap grows as the clusters vary more; for a continuous outcome, as in Section 2, the two kinds of estimate are the same. Two template openings help: "for two people in the same cluster..." for a GLMM result and "across the whole population, averaging over clusters..." for a GEE result.
- 6.4 Choose between the two mainly by asking who wants the answer and what they want to know. A question about individual clusters, such as a clinic manager asking how much higher the odds are for a patient in her own clinic, points to the GLMM and its cluster-specific odds ratio; a question about the population as a whole, such as a provincial planner asking how referral differs across the province, points to GEE and its population-averaged odds ratio. Then check the number of clusters: a GLMM works with about 20 to 30, but GEE needs about 30 to 40 or more for reliable sandwich standard errors, so the 30 clinics here sit at the lower limit for GEE. Keep in mind that only the mixed model estimates how much the clusters vary, while GEE makes no assumption about how the cluster effects are distributed. Many papers report one method as the main analysis and the other as a sensitivity analysis, and when the two agree, as they do for urban clinics here, the conclusion is stronger.
- 6.5 Each approach has a short checklist, and Table 5.7 sets it out. Both methods need a binary outcome with enough events, about 10 per predictor (check with
table(); there were 246 referrals here), and clusters that are independent of one another, which you judge from the design. For the GLMM, check that the cluster effects look roughly normal on a Q-Q plot ofranef(), that there are about 20 to 30 clusters or more, and whether R printed any convergence warnings. For GEE, sort the data by the cluster identifier before fitting, give the right variable toid, and confirm that theNumber of clustersline matches the number you expect and is large enough (about 30 to 40 or more). Sorting is the easy step to forget:geeglm()treats consecutive rows with the sameidas one cluster, so scattered rows split a cluster and give wrong standard errors without any warning.
1. A study of influenza vaccination (yes or no) includes 1,920 adults aged 65 and older registered at 48 primary care clinics (40 per clinic), and 24 of the clinics use an automated reminder system. Vaccination was modelled with ordinary logistic regression, a GLMM and GEE, each adjusted for age, giving the odds ratios below (standard errors on the log-odds scale in brackets). Which statement explains the pattern of standard errors and says which results to report?
| Model | Chronic condition: OR (SE) | Reminder system: OR (SE) |
|---|---|---|
glm() | 1.70 (0.10) | 1.30 (0.10) |
GLMM, glmer() | 1.80 (0.11) | 1.36 (0.19) |
GEE, geeglm() | 1.65 (0.10) | 1.26 (0.18) |
glm() to 0.19 in the GLMM and 0.18 in GEE, while the standard error for chronic condition stays at about 0.10, because chronic condition varies within every clinic and can be compared within clinics. The reminder system takes one value per clinic, so glm(), which counts 1,920 independent adults, overstates the information about it. The option preferring glm() is wrong because all three models use the same 1,920 adults; glm() looks more precise only because it wrongly assumes independence. (Section 3, 6.1 How a GLMM and GEE Allow for Clustering and 6.2 Odds Ratios and Standard Errors from the Three Models, Table 5.6; Objectives 6.1 and 6.2)2. In the vaccination study, the GLMM (glmer() with a random intercept for each clinic) gives an odds ratio of 1.80 (95% CI 1.45 to 2.23) for having a chronic condition, adjusted for age and the reminder system. Which interpretation is correct?
3. GEE (geeglm() with the clinic as the cluster) gives an odds ratio of 1.65 (95% CI 1.36 to 2.01) for chronic condition, compared with 1.80 from the GLMM. Which statement is correct?
4. Two people ask about the vaccination study, which has 48 clinics. A clinic manager wants to know how much higher the odds of vaccination are for a patient with a chronic condition than for a similar patient in her own clinic. A provincial planner wants to know how vaccination differs between older adults with and without a chronic condition across the province. Which estimates suit them?
5. Which of the following is a check that the GEE result for the vaccination study requires before it is reported?
Number of clusters line showing 48. The information needed is how geeglm() identifies clusters: it treats consecutive rows with the same id as one cluster, so unsorted data split a clinic into several clusters and give wrong standard errors without any warning. The Q-Q plot of cluster effects is a GLMM check, because GEE has no clinic effects and makes no assumption about their shape, and a small working correlation still matters when clusters are large, just as a small ICC does (Section 1, Worked Example 5.1), so a low alpha does not justify glm(). The other requirements for both methods are a binary outcome with enough events (about 10 per predictor), independent clusters and, for GEE, about 30 to 40 clusters or more. (Section 3, 6.5 Checking a GLMM and GEE, Table 5.7 and the callout “Sort the Data Before Using geeglm()”; Objective 6.5)6. A study of a smoking-cessation counselling service, which 24 of 48 community pharmacies offer, modelled whether each of 2,400 customers had quit at six months, adjusted for age and heavy smoking. The odds ratios for the service are shown below (the GEE output reports Number of clusters: 48). The provincial health ministry asks how the odds of quitting compare, across all customers in the province, between pharmacies with and without the service. Which result and reading suit the ministry?
| Model | Counselling service: OR (95% CI) |
|---|---|
glm() | 1.55 (1.30 to 1.85) |
GLMM, glmer() | 1.62 (1.15 to 2.28) |
GEE, geeglm() | 1.50 (1.08 to 2.08) |
glm() interval is narrow only because it treats the 2,400 customers as independent, although the service takes one value per pharmacy, and an odds ratio of 1.50 means 50% higher odds, not that 50% of customers quit. (Section 3, 6.3 Clinic-Specific and Population-Averaged Odds Ratios with the flip card “Population-Averaged Odds Ratio”, 6.4 Choosing Between a GLMM and GEE and Table 5.7; Objectives 6.3 and 6.4)Repeated Measures Over Time
Individual lines and arm averages
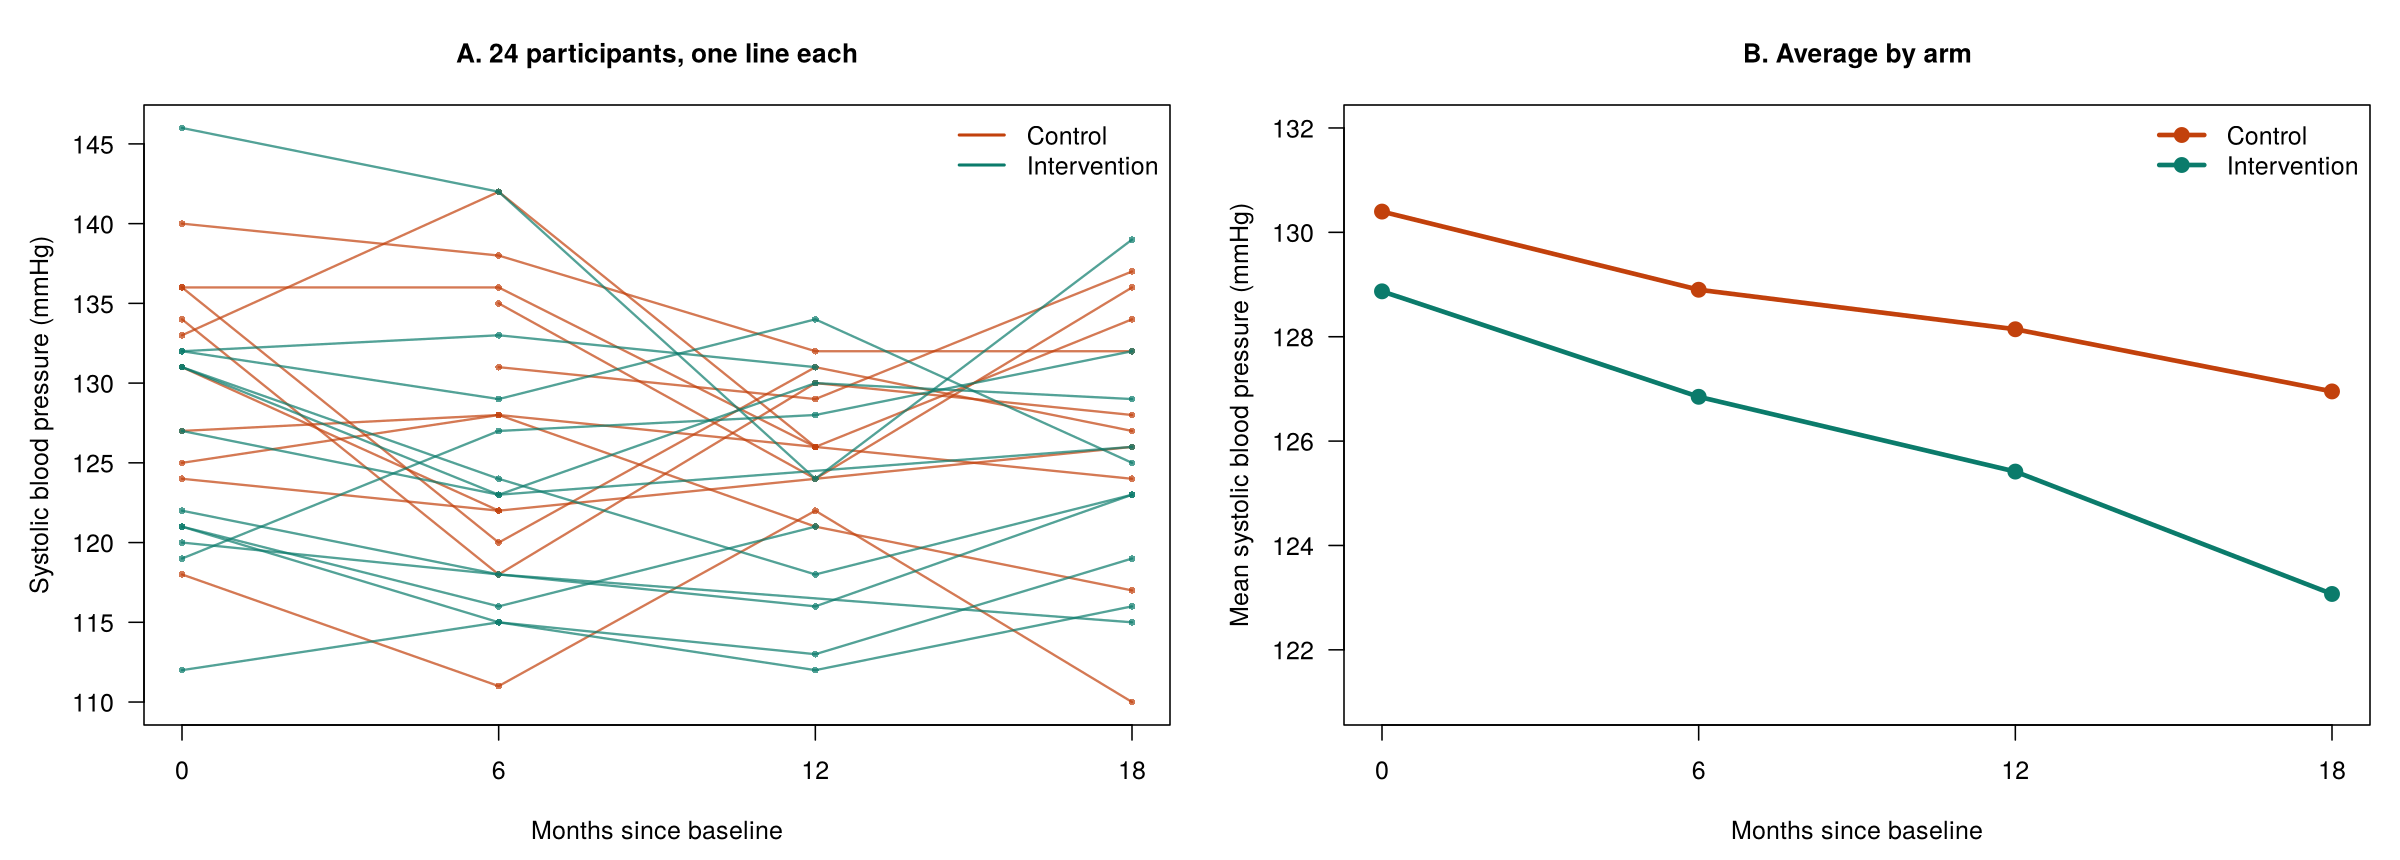
Adherence over time
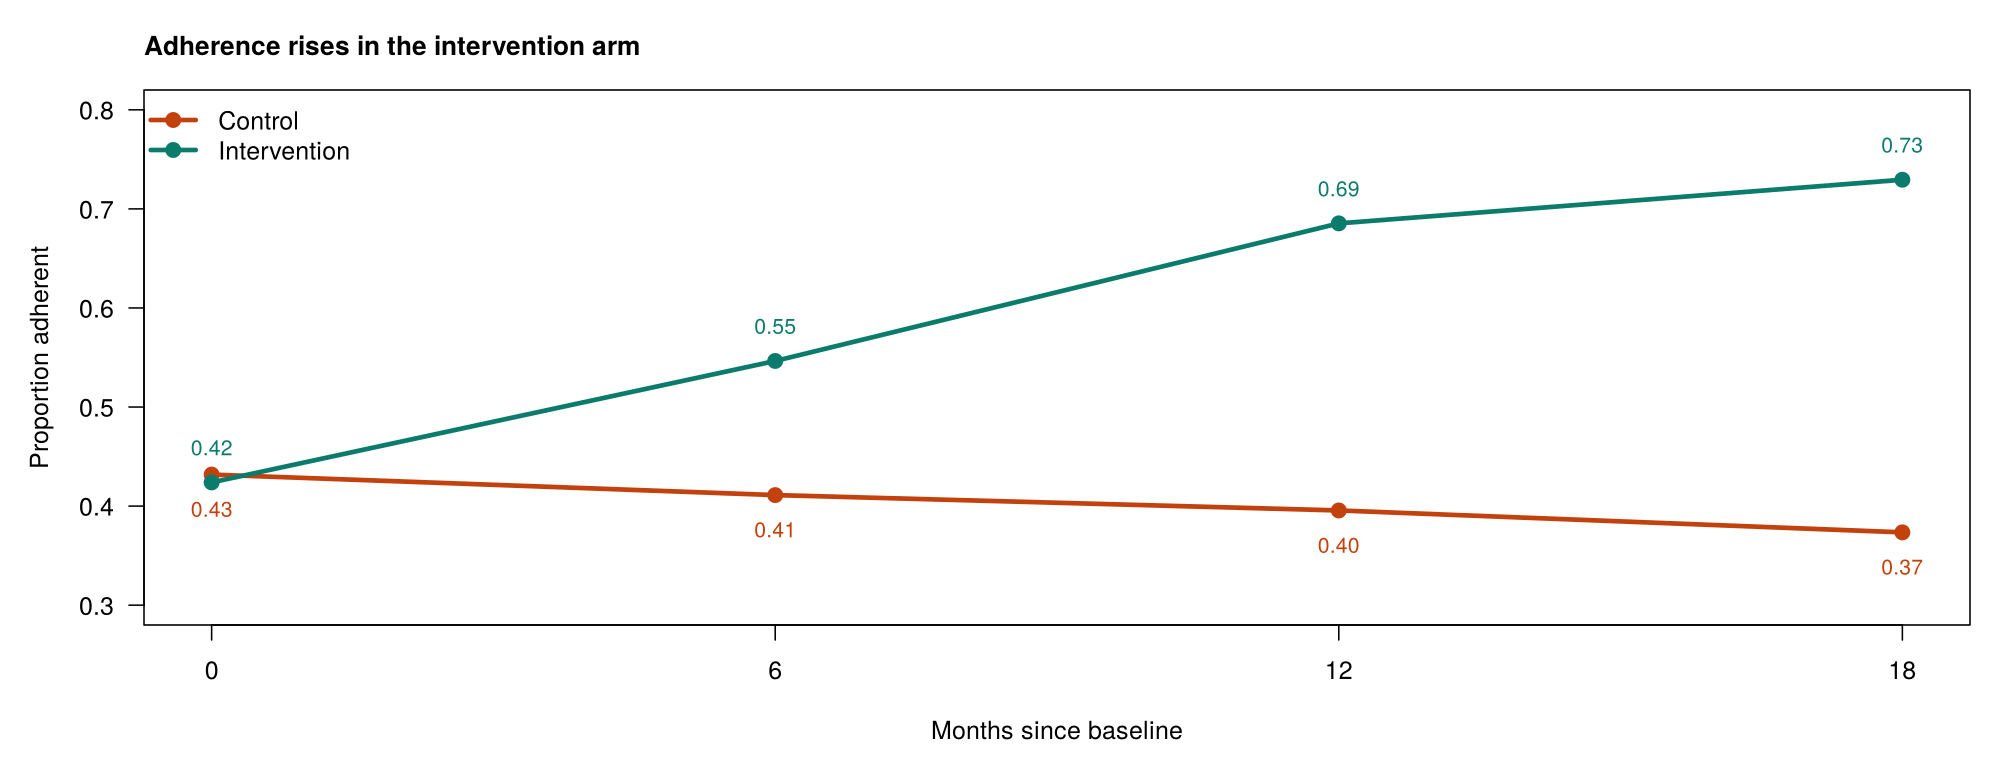
geeglm(adherent ~ arm * visit, id = id, family = binomial, corstr = "exchangeable").Overview
This section applies the methods of the lesson to repeated measures, in which the same people are measured at several times. The example is phaa_repeated.csv, a simulated wellness trial in which 200 adults were assigned to a control arm or an intervention arm (100 each) and were due to attend visits at 0, 6, 12 and 18 months. At each visit the study recorded systolic blood pressure (sbp_mmhg) and whether the person was adhering to the program (adherent = 1). The section explains why each person is a cluster of visits, how repeated-measures data are laid out, how missed visits affect the analysis, how a linear mixed model with an arm-by-time interaction answers the main question of the trial, and how GEE models the repeated binary outcome.
Learning Objectives
- 1.2 Recognise repeated-measures data and explain why each person is a cluster of observations.
- 7.1 Distinguish long from wide format and identify the variables a repeated-measures model needs.
- 7.2 Explain how a complete-case analysis, a mixed model and GEE each handle missed visits, and what the missing-at-random condition means.
- 7.3 Interpret a linear mixed model with an interaction between study arm and time.
- 7.4 Interpret a GEE model for a repeated binary outcome, and list the checks for repeated-measures analyses.
1.2 Repeated Measures as Clustered Data
When the same person is measured more than once, the measurements share that person's genes, habits, circumstances and baseline health, so they are more alike than measurements from different people. Each person is therefore a cluster of visits, identified by a variable such as id, and the methods from the earlier sections apply with the person in place of the clinic; the cluster is the person, not the visit or the year. In this trial, the ICC for blood pressure is 0.56: more than half of the variation is a stable difference between people, much more than the clustering of patients in clinics (0.175), because repeated measurements of one person share far more than patients who only share a clinic. Even a weak correlation between a person's visits still breaks the independence assumption, so an ordinary regression is not the right choice for repeated measures.
A plot of the measurements over time shows this dependence before any model is fitted. Figure 5.7 shows the blood pressure of individual participants at each visit and the average in each arm.
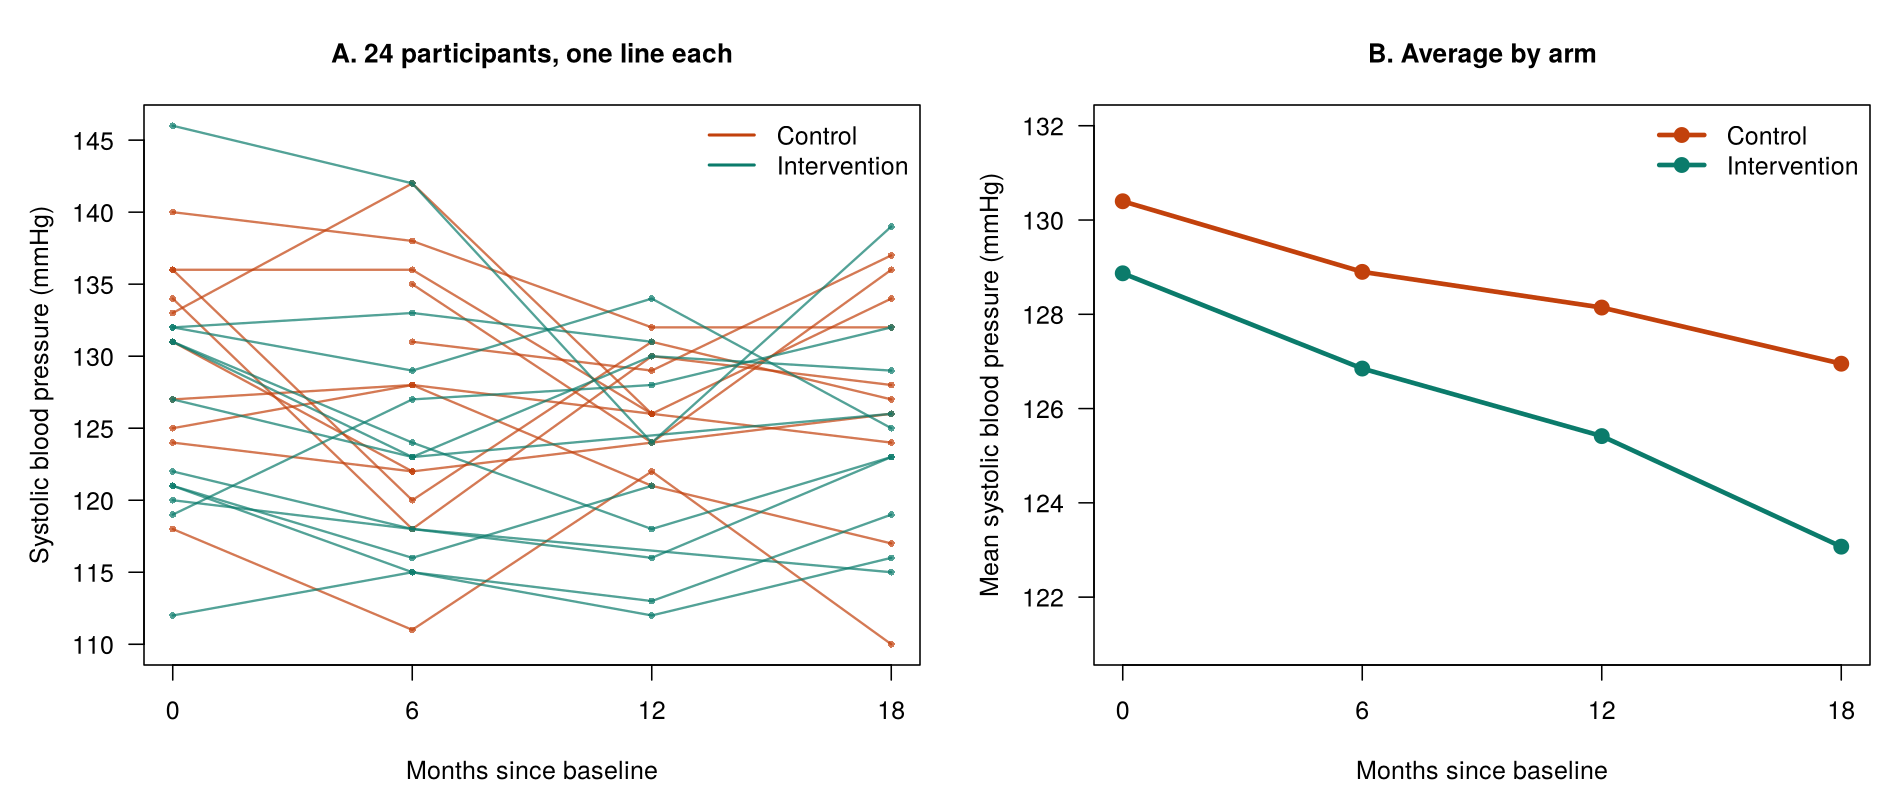
The spaghetti plot (panel A) shows the dependence directly: people start at very different levels and tend to stay there. The averages (panel B) fall in both arms, from 130.4 to 127.0 mmHg in the control arm and from 128.9 to 123.1 mmHg in the intervention arm, and the roughly straight lines suggest that a linear trend over time is reasonable. To fit a model to these repeated measurements, the data first have to be arranged in the right layout.
7.1 Long and Wide Format
Repeated-measures data can be stored in wide format, with one row per person and a column for each visit, or in long format, with one row per visit and columns for the person identifier, the visit time and the outcome. Mixed models and GEE in R need long format, because they follow change over time and need the person identifier and the time on every row. The trial file is already in long format, with 800 rows, four for each of the 200 people. Table 5.8 shows the first five rows of the file.
Table 5.8. The first five rows of phaa_repeated.csv in long format, with one row per visit.
| id | arm | visit (months) | sbp_mmhg | adherent |
|---|---|---|---|---|
| R0001 | control | 0 | 132 | 0 |
| R0001 | control | 6 | 131 | 0 |
| R0001 | control | 12 | 141 | 0 |
| R0001 | control | 18 | 126 | 0 |
| R0002 | control | 0 | 127 | 1 |
The id column identifies the person (the cluster), visit records months since the start, and each person appears once for each visit. In wide format, the same person R0001 would be a single row with columns such as sbp_0, sbp_6, sbp_12 and sbp_18. The base R function reshape() or tidyr::pivot_longer() converts wide data to long format. A long file also shows a missed visit simply as a row with a missing outcome, which raises the question of how the analysis should treat missed visits.
7.2 Missed Visits
Of the 800 planned measurements of blood pressure, 96 are missing (the first table() line of Activity 5.4 counts them by visit), and only 121 of the 200 participants attended all four visits. One simple option would be to drop everyone with a missed visit, which is called a complete-case analysis. This would discard 79 people, and it causes two problems. The first is a loss of precision, because the measurements those 79 people did provide are thrown away. The second, more serious, problem is possible bias. If the people who missed visits differ from those who attended every one, for example because people whose blood pressure was rising were more likely to drop out, then the people who remain are no longer typical of the trial, and the results describe only the more committed or healthier participants.
There is one situation in which a complete-case analysis of a regression model still gives unbiased coefficients: when the chance that a record is incomplete depends only on the predictors in the model and not on the outcome. In that case dropping incomplete records costs precision but does not distort the coefficients; this exception refines the general statement that listwise deletion is biased unless the data are MCAR. In repeated-measures data, however, the exception rarely helps, because a missed visit often depends on the person’s earlier outcome values. For example, a participant whose blood pressure was high at 6 months may be less likely to attend at 12 months, and then the exception does not apply. A mixed model avoids discarding anyone. Because it models each visit as a separate row, it uses every measurement that was taken, here 704 measurements from all 200 people, so a person who attended three of the four visits still contributes those three measurements.
Whether the mixed model's results are valid depends on why visits were missed. The recall below revisits the three missing-data mechanisms from Lesson 2; try its retrieval question before opening the answer.
Recall: Missing-Data Mechanisms (Lesson 2, Section 1)
Lesson 2, Section 1 set out Rubin’s three missing-data mechanisms. Data are missing completely at random (MCAR) when the chance that a value is missing is unrelated to any value, observed or not. They are missing at random (MAR) when that chance depends only on values that were observed, and missing not at random (MNAR) when it depends on the missing value itself. Students who took HSCI 230 first met these mechanisms in Lesson 8, Section 2 (Attrition and Nonresponse Bias) and Lesson 11, Section 2 (Statistical Inference and Model Issues).
Retrieval question. A participant in the wellness trial misses the 12-month visit. Give one reason for the missed visit that would make the missing blood pressure MAR, and one that would make it MNAR.
The mechanism that matters for a mixed model is missing at random, stated in plain terms for the trial in the definition below.
Missing at Random, in Plain Terms
A mixed model fitted to all available visits gives valid results when the chance of missing a visit depends only on information the model already uses, such as the person's arm or their blood pressure at earlier visits. This condition is called missing at random (MAR). It would fail if, for example, people stayed away from a visit because their blood pressure was high on that day, in a way the earlier visits could not predict. MAR cannot be proved from the data, but it is a much weaker assumption than the complete-case assumption that people who attended every visit are typical of everyone. Comparing people who missed visits with those who did not at their first visit shows which measured characteristics predict a missed visit, so that they can be included in the model. The comparison cannot confirm MAR, because MAR concerns the values that were never recorded.
GEE needs a stronger condition about missed visits than the mixed model. Its results are valid when the chance of missing a visit depends only on the predictors in the GEE model, here arm and visit. The difference arises because the mixed model treats a person’s visits as related to one another, so the visits a person did attend inform the model about the visits that person missed. GEE, by contrast, does not use earlier outcomes in this way, so it cannot correct for dropout that depends on them. For example, if participants whose blood pressure was high at 6 months were more likely to miss the 12-month visit, the mixed model can allow for this through their 6-month value, whereas standard GEE cannot. If missed visits depend on earlier outcomes, such as earlier blood pressure or adherence, a mixed model, or a weighted form of GEE that is beyond this lesson, is preferred.
When the missing-at-random condition holds, a mixed model fitted to all 704 available measurements gives valid results. The next part fits that model to the blood pressure data.
7.3 A Mixed Model for Change Over Time
The model for blood pressure includes a random intercept for each person and fixed effects for arm, visit and their interaction. Equation 5.5 writes the model; the interaction term β3 carries the main question of the trial.
Table 5.9 gives the estimates of the fixed effects for arm, visit and their interaction, with an interpretation of each. The arm term describes only the difference between the arms at the start, so reading it as the effect of the program is a common error. This is because, once the model includes an interaction between arm and visit, the arm coefficient refers to the point where visit equals 0, that is, month 0, before the program could have had any effect. The visit term, in turn, is the change per month in the control arm only. The effect of the program on the trend is the interaction, which measures how much faster or slower blood pressure changes each month in the intervention arm than in the control arm. In other words, the trial's main question, whether blood pressure falls faster with the program, is answered by the interaction term and not by the arm term.
Table 5.9. Fixed effects from the random-intercept model for blood pressure over time.
| Term | Estimate | SE | p-value | Interpretation |
|---|---|---|---|---|
| Intervention arm (month 0) | −1.32 mmHg | 1.07 | 0.22 | The arms start at similar levels, as expected after randomization. |
| Visit (control arm, per month) | −0.160 mmHg | 0.043 | < 0.001 | Blood pressure falls by about 0.16 mmHg per month in the control arm. |
| Arm × visit (per month) | −0.149 mmHg | 0.061 | 0.014 | Blood pressure falls an extra 0.15 mmHg per month in the intervention arm. |
Activity 5.4 obtains the extra fall over the 18 months of the trial in R with 18 * fixef(lmm_t)[["armintervention:visit"]], which prints −2.69: blood pressure in the intervention arm falls about 2.7 mmHg more than in the control arm over the trial. The random effects give a between-person variance of 34.80 and a within-person variance of 27.58, and the ICC line in the activity prints 0.56, the between-person share of their total.
Worked Example 5.4 applies Equation 5.5 to predict blood pressure at month 18 in each arm from the intercept and the estimates in Table 5.9; watch which terms each prediction adds.
Worked Example 5.4: Predicted Blood Pressure at Month 18
For a typical person in each arm at month 18, predict() in R gives 127.1 mmHg in the control arm and 123.1 mmHg in the intervention arm. The control-arm prediction combines the intercept with 18 months of the control-arm change per month; the intervention-arm prediction also adds the difference at the start and 18 months of the extra change per month, which is why the two arms end further apart than they began. Both are close to the observed averages of 127.0 and 123.1 mmHg.
The predictions show how the per-month estimates add up over the trial. Because the arms of this trial were assigned at random, a difference in trends between them can be read as an effect of the program. When the groups were not randomized, for example when clinics or workplaces chose whether to run a program, the same interaction describes how the trends differ, but other differences between the groups could explain part of it, so it is reported as an association.
The model can be extended in two ways that appear in published longitudinal studies but are beyond the scope of this lesson. Expand the panel below to read about random slopes for time and a correlation that depends on the time between visits.
The random-intercept model gives each person their own level but the same slope over time within each arm. A random slope, (visit | id), would let each person have their own rate of change. In this trial that model produces a convergence warning, because four visits per person give little information about individual slopes. Visits close together in time are also often more alike than visits far apart, a pattern that models with an autoregressive correlation structure (such as AR(1)) describe. Both extensions appear in published longitudinal studies and are beyond the scope of this lesson.
The mixed model shows an extra fall of about 2.7 mmHg over 18 months in the intervention arm. The trial also recorded a binary outcome at each visit, and the next part models it with GEE.
7.4 GEE for a Repeated Binary Outcome, and the Checks for Repeated Measures
Adherence is recorded as yes or no at each visit. The share adherent falls slightly in the control arm (0.43 at month 0 to 0.37 at month 18) and rises steadily in the intervention arm (0.42 to 0.73). Figure 5.8 shows these proportions at each visit.
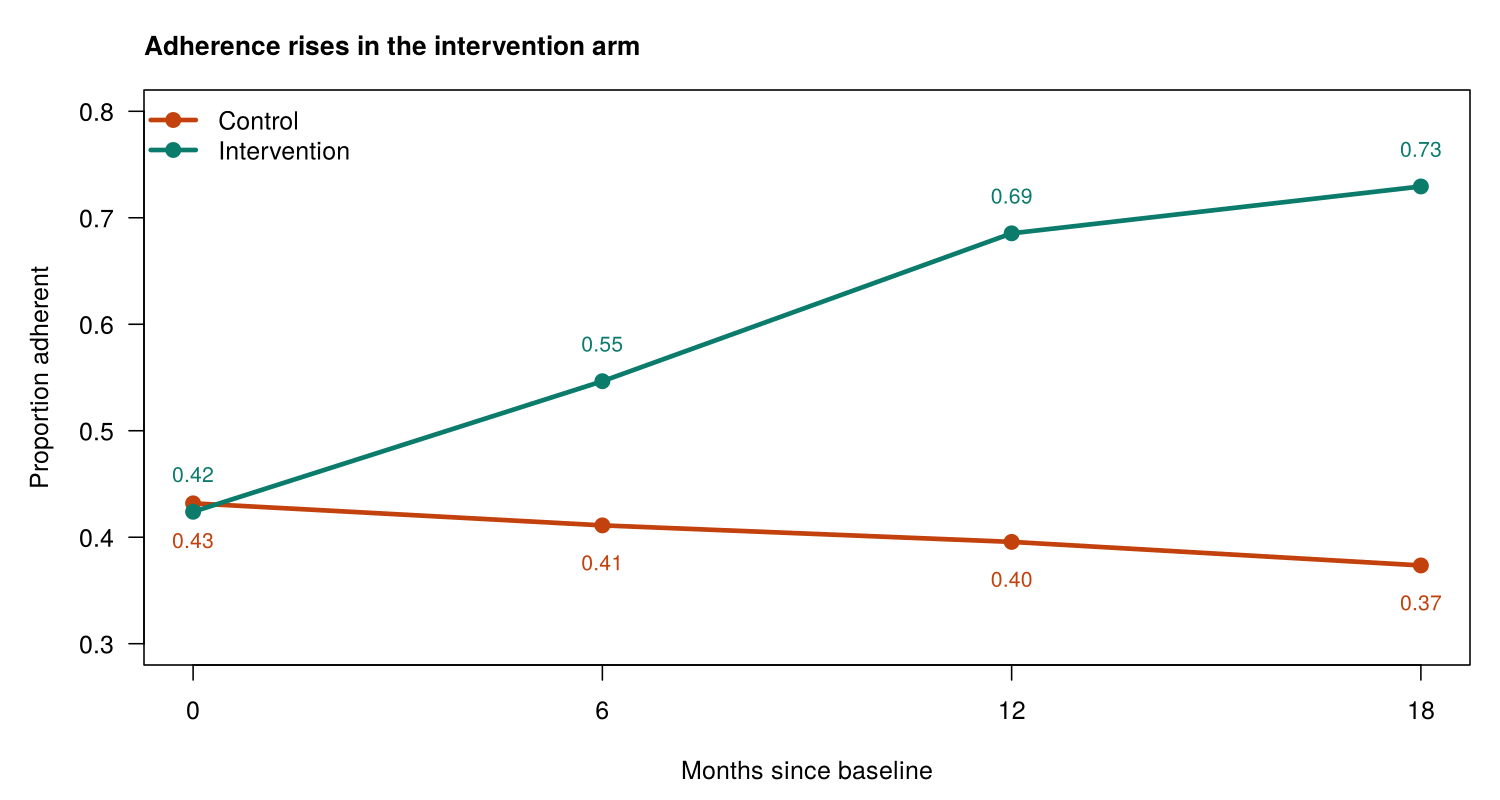
A GEE model with the person as the cluster (id = id) gives population-averaged odds ratios for the trial, which matches the question of how the program changes adherence across participants. With 200 people there are plenty of clusters for the corrected standard errors. Table 5.10 gives the odds ratios from this model.
Table 5.10. Odds ratios from the GEE model for adherence over time.
| Term | Odds ratio | 95% CI | Interpretation |
|---|---|---|---|
| Intervention arm (month 0) | 1.00 | 0.60 to 1.69 | The arms start with the same odds of adherence. |
| Visit (control arm, per month) | 0.99 | 0.96 to 1.02 | Adherence in the control arm barely changes. |
| Arm × visit (per month) | 1.093 | 1.041 to 1.147 | The monthly odds ratio in the intervention arm, which R prints as 1.079 from exp(coef(gee_a)[["visit"]] + coef(gee_a)[["armintervention:visit"]]), shows a rise of about 8% per month. |
Over one six-month interval between visits, R gives the interaction odds ratio with exp(6 * coef(gee_a)[["armintervention:visit"]]), which prints 1.70. Odds ratios multiply over time rather than add, so the interaction odds ratio for six months is not six times the monthly one. This is because the model is linear on the log-odds scale: each month adds the same amount to the log-odds, and adding on the log scale corresponds to multiplying on the odds scale. A monthly odds ratio is therefore applied once for each month, so its effect compounds over six months in the way that interest compounds in a savings account, which is why R calculates the six-month value by exponentiating six times the monthly coefficient. The estimated exchangeable correlation between a person's visits is 0.07, much weaker than the correlation for blood pressure, but GEE allows for it in the standard errors. Provided that missed visits depend only on arm and visit, GEE therefore shows a steady rise in adherence in the intervention arm.
Before either repeated-measures model is reported, it needs some of the checks from the earlier sections together with checks of its own, which concern the layout of the data, the coding of time and the missed visits. Table 5.11 lists them for the mixed model and for GEE.
Table 5.11. Assumptions and requirements of a repeated-measures analysis, with how to check them.
| Assumption or requirement | How to check it |
|---|---|
| Data in long format with a person identifier | head(data); for GEE, sort by id and then by visit. |
| Time coded correctly and the trend shape reasonable | Plot the averages by visit; roughly straight lines support a linear trend in visit. |
| Residual assumptions for the mixed model | Residuals versus fitted values and Q-Q plots, as in Section 2. |
| Missed visits: missing at random for the mixed model; related only to the model's predictors for GEE | Count missing values by visit and compare people who missed visits with those who did not. This shows which variables to include; it cannot confirm MAR. |
| Enough clusters for GEE | The Number of clusters line of the output (200 here). |
| Independent people | Judged from the study design (one person per household, for example). |
These checks complete the analysis of the wellness trial and the methods of the lesson.
Additional Context
This closing review adds no new methods; it sets the four examples of the lesson side by side. The four sections apply one approach. The cluster variable is identified first, the clustering is measured with the ICC, and a model is chosen that allows for it: a linear mixed model for a continuous outcome, a GLMM or GEE for a binary outcome, and the same models with the person as the cluster for repeated measures. Table 5.12 summarises the four examples with the cluster, the model and R function, and the main result of each.
Table 5.12. The four examples of the lesson, with the cluster, model and main result of each.
| Example | Cluster | Model and R function | Main result |
|---|---|---|---|
| Blood pressure in clinics | Clinic | Linear mixed model, lmer() | Urban minus rural 1.85 mmHg (−1.85 to 5.54); ICC 0.24 |
| Referral in clinics | Clinic | GLMM, glmer(), and GEE, geeglm() | Urban OR 2.31 (GLMM) and 2.04 (GEE) |
| Blood pressure over time | Person | Linear mixed model, lmer() | Extra fall of 0.149 mmHg per month in the intervention arm |
| Adherence over time | Person | GEE, geeglm() | Interaction OR 1.093 per month (1.041 to 1.147) |
Activity 5.4 lets you fit the mixed model for blood pressure over time and then the GEE model for adherence in R, from the check of missed visits to the interaction over the whole trial: run the script and answer the questions from your own output.
Text version of the activity: the code of the run-along script, its console output and notes on reading it.
library(lmerTest)   # loads lme4 and adds p-values to lmer() output
visits <- read.csv("https://heal-learn.ca/r-activities/data/phaa_repeated.csv")   # course data, read from the website
visits$id  <- factor(visits$id)   # the person: the cluster
visits$arm <- factor(visits$arm, levels = c("control", "intervention"))
head(visits, 8) # long format: one row per visitThe first eight rows show the long format: the first person has four rows, one for each visit at months 0, 6, 12 and 18, followed by the second person. The id column identifies the person, who is the cluster, and visit records months since the start.
table(visit = visits$visit, missing = is.na(visits$sbp_mmhg))
all4 <- tapply(!is.na(visits$sbp_mmhg), visits$id, all)   # all four visits?
table(all4)                  # FALSE: missed at least one visit
first <- visits[visits$visit == 0, ]           # each person's month-0 row
round(tapply(first$sbp_mmhg, all4[first$id], mean, na.rm = TRUE), 1)Between 20 and 32 blood pressures are missing at each visit (96 of the 800 planned measurements), and 121 of the 200 people attended all four visits. People who missed at least one visit had a similar average blood pressure at month 0 (129.0 mmHg) to people who attended every visit (129.9 mmHg). This comparison shows which measured characteristics predict a missed visit; it cannot confirm that the visits are missing at random, because that concerns values that were never recorded.
round(tapply(visits$sbp_mmhg, list(visits$arm, visits$visit), mean, na.rm = TRUE), 1)
lmm_t <- lmer(sbp_mmhg ~ arm * visit + (1 | id), data = visits)
summary(lmm_t)Reading the output. The averages by arm and visit match Figure 5.7 and fall in roughly straight lines. The line Number of obs: 704, groups: id, 200 confirms that the model used all 704 available measurements from all 200 people. In the Fixed effects block, armintervention (−1.32, p = 0.22) is the difference between the arms at month 0, visit (−0.160, p < 0.001) is the change per month in the control arm, and armintervention:visit (−0.149, p = 0.014) is the extra change per month in the intervention arm.
vc <- as.data.frame(VarCorr(lmm_t))
vc$vcov[1] / sum(vc$vcov)                      # ICC: how alike a person's visits are
18 * fixef(lmm_t)[["armintervention:visit"]] # extra change over 18 monthsThe first line prints the ICC, 0.56: more than half of the variation in blood pressure lies between people, so a person's visits are strongly alike. The second line prints the extra change in the intervention arm over the 18 months of the trial, −2.69: blood pressure fell about 2.7 mmHg more in the intervention arm than in the control arm.
library(geepack)
adh <- visits[!is.na(visits$adherent), ]       # visits with adherence recorded
adh <- adh[order(adh$id, adh$visit), ]         # each person's rows together
round(tapply(adh$adherent, list(adh$arm, adh$visit), mean), 2)   # share adherent
gee_a <- geeglm(adherent ~ arm * visit, id = id, family = binomial,
                corstr = "exchangeable", data = adh)
summary(gee_a)
options(digits = 7)   # summary() lowers the printed digits; this restores them
round(exp(cbind(OR = coef(gee_a), confint.default(gee_a))), 3) # odds ratios, 95% CIsReading the output. The shares adherent match Figure 5.8. geeglm() treats consecutive rows with the same id as one cluster, so the rows are sorted by person and visit before the model is fitted. In the GEE output, armintervention (0.005) shows no difference between the arms at month 0, visit (−0.012) shows little change in the control arm, and armintervention:visit (0.089, p < 0.001) shows that adherence rises faster in the intervention arm. The estimated correlation between a person's visits (alpha) is 0.07, and Number of clusters: 200 confirms that each person is a cluster. The odds ratio for the interaction is 1.093 per month (95% CI 1.041 to 1.147); confint.default() gives Wald confidence intervals from the corrected standard errors.
R Reflect on what you just ran
Answer each question from your own output, as on the final exam: find the number, say what it means and state what the model assumes.
1. Only 704 of the 800 planned measurements were taken (Number of obs: 704, groups: id, 200), and 121 of the 200 people attended all four visits. Why is the mixed model, which uses every visit that took place, better than analysing only the 121 people who attended all four? What must be true about the missed visits for its results to be valid?
2. Interpret the ICC of 0.56 (vc$vcov[1] / sum(vc$vcov)). Which coefficient answers the question whether blood pressure falls faster in the intervention arm? Interpret it, using the change over the 18 months of the trial.
armintervention:visit answers the question: it is the extra change per month in the intervention arm. Blood pressure falls by a further 0.149 mmHg per month in the intervention arm (SE 0.061, p = 0.014), on top of the fall of about 0.16 mmHg per month in the control arm. Line 28 prints the extra change over the 18 months of the trial, −2.69: blood pressure fell about 2.7 mmHg more in the intervention arm than in the control arm. The model predicts a fall of about 2.9 mmHg in the control arm and about 5.6 mmHg in the intervention arm, about twice the decline. The arms start at similar levels (armintervention −1.32 mmHg, p = 0.22), as expected after randomization, so the difference in trends can be read as an effect of the program.3. Run your own code: at the end of the script, type exp(coef(gee_a)[["visit"]] + coef(gee_a)[["armintervention:visit"]]) and exp(6 * coef(gee_a)[["armintervention:visit"]]) and run them. Interpret the odds ratio for armintervention:visit with its confidence interval. Then use your two results to give the odds ratio for one month in the intervention arm and the interaction odds ratio for one six-month interval between visits.
Your output from Activity 5.4 reproduces the estimates in Tables 5.9 and 5.10 and shows how the missed visits were examined. The key takeaways below draw the section together before its knowledge check.
Key Takeaways
- 1.2 Repeated measures are clustered data in which the cluster is the person. When someone is measured several times, every measurement carries that person's genes, habits, circumstances and baseline health, so their visits are more alike than visits from different people, and each person becomes a cluster of visits. This clustering is usually strong: in the wellness trial the ICC for blood pressure was 0.56, so more than half of the variation was a stable difference between people, compared with 0.175 for patients in clinics. In a question, the giveaway is a design in which the same people are measured at several times; the cluster is then the person, identified by a variable such as
id, and not the visit or the year. Even a weak correlation between a person's visits, such as the 0.07 for adherence, still breaks the independence assumption, so an ordinaryglm()is not the right choice. - 7.1 Repeated-measures data can be laid out in two ways, and the models in this lesson need one of them. In wide format each person has a single row with a column for each visit (such as
sbp_0,sbp_6,sbp_12andsbp_18), while in long format each visit has its own row, so a person with four visits appears four times. Mixed models and GEE in R need long format, with a column for the person identifier (the cluster), a column for the time of the visit and a column for the outcome, plus any predictors such as the study arm. Look at the first rows withhead()before fitting anything, and convert wide data withreshape()ortidyr::pivot_longer(). If a question asks why the data have one row per visit, explain that the model follows change over time and needs the person identifier and the time on every row. - 7.2 Missed visits are common in repeated-measures studies, and each analysis treats them differently. A complete-case analysis drops everyone with a missed visit (79 of the 200 people in the trial), which wastes information and can bias the results if the people who missed visits differ from those who attended every one. A mixed model uses every visit that was attended (704 of the 800 planned measurements, from all 200 people) and gives valid results if visits are missing at random (MAR): the chance of missing a visit depends only on information the model already uses, such as the arm or earlier measurements, and not on the unrecorded value itself. GEE needs the stronger condition that missed visits depend only on its predictors, here arm and visit. MAR cannot be proved from the data, because it concerns values that were never recorded; comparing people who missed visits with those who did not shows which measured characteristics to include in the model, so state MAR in your answer as an assumption rather than as a fact.
- 7.3 In a trial, the main question is usually whether the groups change at different rates, and the arm-by-time interaction answers it. In
lmer(sbp_mmhg ~ arm * visit + (1 | id)), thearmterm is the difference between the arms at the start (−1.32 mmHg, p = 0.22, so the arms start at similar levels, as expected after randomization), thevisitterm is the change per month in the reference (control) arm (−0.160 mmHg), and thearm:visitinteraction is the extra change per month in the intervention arm (−0.149 mmHg, p = 0.014). A common trap is to read thearmterm as the effect of the program, when it only describes the start. To make the interaction easier to picture, read it over the whole follow-up, which R gives with18 * fixef(lmm_t)[["armintervention:visit"]](−2.69, an extra fall of about 2.7 mmHg over 18 months), and read predicted values at a given time from the model, as in Worked Example 5.4. Because the arms were randomized, the interaction can be read as an effect of the program; when groups were not randomized, report it as an association. - 7.4 For a repeated yes-or-no outcome, GEE with the person as the cluster (
id = id) gives population-averaged odds ratios, which suit a question about how the program changes adherence across participants, and 200 people provide plenty of clusters. The interaction odds ratio, 1.093 per month (95% CI 1.041 to 1.147), multiplies the control arm's monthly odds ratio, so the intervention arm's monthly odds ratio, which R gives withexp(coef(gee_a)[["visit"]] + coef(gee_a)[["armintervention:visit"]]), is 1.08, a rise of about 8% per month, while the control arm barely changes. Odds ratios multiply over time rather than add, so over a six-month interval the interaction odds ratio, fromexp(6 * coef(gee_a)[["armintervention:visit"]]), prints 1.70, which is why a monthly odds ratio cannot simply be multiplied by six. Before reporting either repeated-measures model, check that the data are in long format and, for GEE, sorted by person and visit; that time is coded correctly and a straight-line trend is reasonable; the residual plots of the mixed model; the pattern of missed visits; theNumber of clustersline for GEE; and that the people are independent of one another.
1. A trial randomized 240 adults with prediabetes to a group lifestyle program or usual care and weighed them at months 0, 3, 6 and 9. The first rows of the data are shown below, and the analysis is lmer(weight_kg ~ arm * month + (1 | id)). Why are the data arranged this way, and why does the model include (1 | id)?
| id | arm | month | weight_kg |
|---|---|---|---|
| P001 | usual | 0 | 92.4 |
| P001 | usual | 3 | 92.0 |
| P001 | usual | 6 | NA |
| P001 | usual | 9 | 91.6 |
| P002 | program | 0 | 84.1 |
| P002 | program | 3 | 83.0 |
(1 | id) gives each person their own baseline. The information needed is the design (the same people weighed four times) and the layout shown (one row per person per visit, with id repeated). A person's weighings share that person's body size and habits, so they are strongly alike; lmer() and geeglm() need long format, with columns for the person identifier (the cluster), the time and the outcome, and the random intercept lets each person have their own level. The wide layout is tempting, but these models cannot use it, so wide data are reshaped to long format first; the row with NA (P001 at month 6) is simply a missed visit. (Section 4, 1.2 Repeated Measures as Clustered Data and 7.1 Long and Wide Format, Table 5.8; Objectives 1.2 and 7.1)2. In the weight trial, the analyst obtained the variances of the model and its ICC in R as shown below. What does the ICC mean, and why is it so much larger than the ICC of 0.175 for patients in the lesson's clinics?
id row) and what a person's repeated measurements share. Two weighings of the same person are correlated at about 0.90; repeated measurements of one person share far more than patients in a clinic do, so their ICC is usually much larger, as the ICC of 0.56 for blood pressure in the wellness trial showed. The last option misreads the ICC as a share of people rather than a share of the variation, the first describes the within-person share, and an ICC can take any value from 0 to 1, so 0.90 is not a sign of an error. (Section 4, 1.2 Repeated Measures as Clustered Data and Activity 5.4; Objectives 1.2 and 3.1)3. The fixed effects of m_wt <- lmer(weight_kg ~ arm * month + (1 | id)) are shown below, with usual care as the reference arm and month counted from the start, followed by three lines that give the change over the 9 months. Which coefficient answers whether weight falls faster in the program arm, and what does it say?
| Term | Estimate (kg) | SE | p-value |
|---|---|---|---|
| (Intercept) | 90.10 | 0.92 | < 0.001 |
armprogram | −0.40 | 1.30 | 0.76 |
month | −0.05 | 0.03 | 0.10 |
armprogram:month | −0.20 | 0.04 | < 0.001 |
armprogram:month interaction, an extra fall of about 1.8 kg over 9 months. The information needed is what each term measures: armprogram is the difference between the arms at month 0, month is the change per month in the reference (usual-care) arm, and armprogram:month is the extra change per month in the program arm, so only the interaction says whether the two slopes differ. The three R lines turn these per-month values into changes over the 9 months: about −0.45 kg with usual care, about −2.26 kg in the program arm, and a difference of about −1.8 kg; because the arms were randomized, the difference in trends can be read as an effect of the program. Reading armprogram as the program effect is the common error, because it is only the (chance) difference at the start, and the interaction is a change per month, not over the whole trial. (Section 4, 7.3 A Mixed Model for Change Over Time, Table 5.9 and Worked Example 5.4; Objective 7.3)4. In the weight trial, 104 of the 960 planned weighings were missed, and only 170 of the 240 adults attended all four visits; the mixed-model output reports Number of obs: 856, groups: id, 240. People whose weight had risen at one visit were more likely to miss the next. Which statement is correct?
Number of obs line), how many adults were complete (170 of 240, so 70 would be dropped) and what predicts a missed visit (the earlier weight, which is recorded). A complete-case analysis would discard 70 people who tended to be gaining weight and is likely to be biased, while the mixed model uses every attended visit and is valid when missing depends only on observed information it includes; this cannot be confirmed, because it concerns weights that were never recorded. GEE needs the stronger condition that missed visits depend only on its predictors (arm and month), which fails when they depend on earlier weights. (Section 4, 7.2 Missed Visits, including the callout “Missing at Random, in Plain Terms” and the condition GEE needs; Objective 7.2)5. The trial also recorded at each visit whether the adult met a physical activity target (yes or no). GEE with the person as the cluster (gee_w) gives an odds ratio per month of 0.98 in the usual-care arm and an interaction odds ratio (armprogram:month) of 1.10 per month (95% CI 1.04 to 1.16). The analyst then ran the two lines below. Which statement reads them correctly?
6. A second trial randomly assigned 300 adults aged 70 and over to a weekly walking group or to usual activities and measured their walking speed (m/s) at months 0, 4, 8 and 12. Of the 1,200 planned visits, 150 were missed, and 228 adults attended all four. As in Activity 5.4, the analyst compared the first-visit speed of adults who missed at least one later visit with that of adults who attended every visit. What does this comparison show?
Lesson 5: Final Assessment
Bringing It All Together
This lesson addressed the assumption of independence that ordinary linear and logistic regression models share. Section 1 showed that observations are dependent when they share a cluster, such as patients in the same clinic or visits by the same person. The intracluster correlation coefficient measured the clustering in the clinic data (0.175 for systolic blood pressure), the design effect of 6.45 showed that the 966 patients carried about as much information as 150 independent patients, and an ordinary regression that ignored the clinics gave a standard error for urban clinics of 0.74 mmHg, compared with 1.96 mmHg from a model that allowed for them.
Section 2 fitted a linear mixed model with a random intercept for each clinic using lmer(). Its fixed effects were read like the coefficients of a linear regression, its random effects gave a clinic variance and a residual variance whose ratio was the adjusted ICC of 0.24, and it was checked with residual plots, a Q-Q plot of the clinic effects, the number of clinics and a test for a singular fit. Section 3 turned to a binary outcome, specialist referral, and compared a logistic mixed model fitted with glmer(), which gives cluster-specific odds ratios, with GEE fitted with geeglm(), which gives population-averaged odds ratios with sandwich standard errors. Section 4 treated each person in a wellness trial as a cluster of visits, arranged the data in long format, and used a mixed model for blood pressure and GEE for adherence, each with an arm-by-visit interaction that answered the main question of the trial and each using every visit that was attended.
Across the lesson, the same steps were followed each time: the cluster variable was identified, the clustering was measured, a model that allows for it was chosen to suit the outcome type and the research question, and the model's assumptions were checked before the results were reported. The final assessment asks for these steps to be applied to new studies.
Key Takeaways from this lesson
- You can now recognise clustered and repeated-measures data from the way a study was designed, such as patients recruited through clinics or people measured at several visits, and name the variable that identifies the clusters, which every method in this lesson needs. The most useful reminder for the exam is that R will not tell you: nothing in the output of an ordinary
lm()orglm()warns that the data are clustered, so always begin by asking how the data were collected. - You can explain why ignoring clustering usually leaves the estimates similar but makes the standard errors, confidence intervals and p-values too small, so that the model is overconfident, and you can sort predictors into cluster-level and person-level ones. Remember that the problem is largest for cluster-level predictors such as an urban clinic or a school-wide program, whereas for person-level predictors allowing for clustering changes the standard error little and can even make it smaller.
- You can interpret the ICC that R reports, read as the share of the outcome's variation that lies between clusters or as the correlation between two people in the same cluster, together with the design effect, 1 + (average cluster size − 1) × ICC, and the effective sample size, n ÷ DEFF. Judge an ICC against the usual 0.01 to 0.1 for clinics, schools and neighbourhoods, but remember that even a small ICC matters when clusters are large. Because the design effect grows with cluster size, adding clusters gains more precision than adding people to each cluster.
- You can read a random-intercept model fitted with
lmer(y ~ x + (1 | cluster)): its fixed effects are interpreted like ordinary regression coefficients for people in the same cluster, its cluster and residual variances give the adjusted ICC, and an estimated cluster shift says how far one cluster's baseline lies above or below the average. Compared with an ordinary regression, expect similar estimates but a larger standard error for a cluster-level predictor. When you interpret a fixed effect, always say which people are being compared, and give the units and the confidence interval. - You can describe how a mixed model is checked: with residual plots, a Q-Q plot of the cluster effects, enough clusters (about 20 to 30 or more) and a test for a singular fit, where
isSingular()should returnFALSE. You can also explain that a random slope lets the effect of a predictor differ between clusters. If a random slope brings a singular-fit or convergence warning, the model is too complex for the data, so report the simpler random-intercept model and say why. - You can interpret odds ratios from a GLMM (
glmer()) and from GEE (geeglm()): for a binary outcome, a GLMM gives cluster-specific odds ratios and GEE gives population-averaged odds ratios, which are usually a little closer to 1. You can choose between them from the research question: the GLMM suits questions about individual clusters, such as a clinic manager's, and GEE suits questions about the population, such as a provincial planner's. Before relying on GEE, check that there are enough clusters (about 30 to 40 or more) and that the data were sorted by cluster. - You can interpret a repeated-measures analysis in long format, with one row per visit and the person as the cluster, including the group-by-time interaction, which tests whether the groups change at different rates. You can also explain why a mixed model that uses every attended visit is valid when missed visits are missing at random, whereas a complete-case analysis can be biased and GEE needs missed visits to depend only on its predictors. For the exam, remember that an interaction describes one unit of time, so read the change over the whole follow-up from R (a line such as
18 * fixef(model)[["arm:visit"]], orexp(6 * coef(model)[["arm:visit"]])for an odds ratio, because odds ratios multiply over time), and state missing at random as an assumption, since the data cannot prove it.
The final assessment covers all four sections. All 16 questions must be answered correctly (100%) to finish the lesson.
Final Knowledge Assessment
1. A health unit runs three studies: (A) a mailed survey of 1,500 adults drawn at random from the provincial health-insurance registry; (B) a dental survey of about 30 children in each of 50 child-care centres; (C) a study that measures the height of each of 300 children once a year for three years. Which classification is correct?
2. A provincial study measured the BMI z-score of 1,550 preschool children in 50 child-care centres (31 per centre). A mixed model with no predictors, m0, was fitted, and the ICC was obtained in R as shown below. Which statement is correct?
icc, the centre variance as a share of the total of the two variances (Equation 5.1), which is both the share of the variation that lies between centres and the correlation between two children in the same centre. Values of 0.01 to 0.1 are typical for clinics, schools and similar settings, so this is an ordinary amount of clustering. Concluding that it is small enough to ignore is the tempting error: with 31 children per centre it gives a design effect of about 2.5 (Question 3), so ignoring it would still make standard errors too small. The ICC is a share of the variation, not of the children. (Section 1, 3.1.1 The Intracluster Correlation Coefficient, Equation 5.1 and Worked Example 5.1; Objective 3.1)3. In the child-care study, the analyst continued in R with the ICC from Question 2 and the average of 31 children per centre, as shown below. What do the design effect and the effective sample size mean?
4. A new child-care study needs the precision of 600 independent children and expects an ICC of 0.05. Plan A recruits 41 children from each centre and Plan B recruits 11 children from each centre. The analyst multiplied 600 by each plan's design effect in R, as shown below. What does the comparison show?
5. In the child-care study, 25 of the 50 centres have a healthy-snack policy. A colleague reports from lm() that the policy is associated with a lower BMI z-score (p = 0.02) and says the output showed no sign of a problem. The results from lm() and from a mixed model with a random intercept for each centre are shown below. What should you tell the colleague?
| Predictor | lm(): estimate (SE), p | lmer(): estimate (SE), p |
|---|---|---|
| Snack policy (centre) | −0.12 (0.050), p = 0.02 | −0.13 (0.080), p = 0.11 |
| Daily sugary drink at home (child) | 0.26 (0.055), p < 0.001 | 0.25 (0.052), p < 0.001 |
lm() is overconfident, and the absence of a warning means nothing, because lm() output cannot show clustering. The estimates are nearly the same in both models, so preferring the mixed model for its larger estimate gives the wrong reason. (Section 1, the callout “Clustering Cannot Be Seen in the Regression Output” in 1.1, and 2.1 to 2.3 with Table 5.2; Objectives 1.1, 2.1, 2.2 and 2.3)6. In the mixed model of Question 5, the snack-policy coefficient is −0.13 (95% CI −0.29 to 0.03), adjusted for age, sex and daily sugary drinks. The centres chose whether to adopt the policy. Which interpretation is correct?
7. From the same mixed model (sugary-drink coefficient 0.25), the model's predicted BMI z-scores for two 4-year-old boys in centres without the policy, one without and one with a daily sugary drink, are shown below for an average centre and for centre C14, whose estimated shift is −0.30. What do the predictions show?
| Boy | Average centre | Centre C14 |
|---|---|---|
| No daily sugary drink | 0.40 | 0.10 |
| Daily sugary drink | 0.65 | 0.35 |
8. The mixed model for the 50 centres passed its checks: the residual plots looked acceptable, the Q-Q plot of the centre effects followed the line, and isSingular() returned FALSE. A colleague plans to fit the same model to a pilot study of 10 centres. What is the main concern?
9. To see whether the sugary-drink difference varies between centres, the analyst fits lmer(zbmi ~ age + girl + sugary + policy + (sugary | centre)). R warns that the model failed to converge, and the sugary-drink estimate is 0.25 in both this model and the random-intercept model. Which statement is correct?
(sugary | centre) adds (each centre gets its own sugary-drink slope as well as its own baseline) and what a convergence warning means: R could not settle on reliable estimates, which, like a singular fit, signals that the random part of the model is more than the data can support. Because the sugary-drink estimate is the same in both models, the conclusion does not depend on the random slope, but the model that failed to converge is not the one reported. Reading the warning as evidence that the slope is the same everywhere is wrong, because a failed fit says nothing reliable about the slopes. (Section 2, 5.2 Random Slopes and Model Warnings; Objective 5.2)10. Overweight (yes or no) was modelled with a GLMM (glmer(), a random intercept for each centre) and with GEE (geeglm(), 50 centres). The odds ratio for a daily sugary drink is 1.60 (95% CI 1.30 to 1.97) in the GLMM and 1.52 (1.26 to 1.83) in GEE. A centre director asks how a daily sugary drink relates to overweight for children in her centre; a provincial planner asks how overweight differs across the province between children with and without a daily sugary drink. Which statement is correct?
11. For the snack policy, ordinary logistic regression (glm()) gives an odds ratio for overweight of 0.84 (95% CI 0.71 to 0.99), and GEE with the centre as the cluster gives 0.85 (95% CI 0.64 to 1.13). Why is the GEE interval wider, and which result should be reported?
glm() assumes that the 1,550 children are independent, so for a predictor that takes one value per centre it overstates the information and gives an interval that is too narrow; GEE's sandwich standard error comes from the variation between the 50 centres. Choosing a result because its interval excludes 1 is the tempting error: the glm() interval excludes 1 only because it ignores the clustering. (Section 3, 6.2 Odds Ratios and Standard Errors from the Three Models and Table 5.6; Objectives 2.2 and 6.2)12. In a separate community study, 360 children were measured once a year for four years. The data file has one row per child with the columns id, sport, z_0, z_1, z_2 and z_3 (the BMI z-score in years 0 to 3), where sport = 1 if the child's parents enrolled them in a free after-school sports program. What must be done before fitting lmer(zbmi ~ sport * year + (1 | id)), and what is the cluster?
lmer() and geeglm() need long format, with one row per measurement and columns for the person identifier, the time and the outcome, which reshape() or tidyr::pivot_longer() can produce. Each child's four measurements share that child's characteristics, so the child is the cluster and (1 | id) gives each child their own baseline. Averaging the four columns would throw away the change over time that the study is about, and the year is the time of a measurement, not a cluster. (Section 4, 7.1 Long and Wide Format; Objectives 1.2 and 7.1)13. The model m_z <- lmer(zbmi ~ sport * year + (1 | id)) gives a coefficient of 0.03 per year for year (p = 0.04) and −0.04 per year for sport:year (95% CI −0.07 to −0.01). Parents chose whether to enrol their child in the sports program. The analyst then ran the lines below. Which interpretation is correct?
14. In the community study, 150 of the 1,440 planned measurements were missed, and children who missed a measurement tended to have had higher z-scores at their previous one. The mixed model used all 1,290 measurements that were taken. Which statement is correct?
15. In the community study, whether each child met the daily activity guideline (yes or no) at each yearly measurement was analysed with GEE (gee_g), with the child as the cluster. The odds ratio per year is 0.90 for children not in the sports program, and the interaction odds ratio (sport:year) is 1.25 per year (95% CI 1.08 to 1.45). The analyst then ran the two lines below. Which statement is correct?
16. A city surveyed 1,800 adults in 45 neighbourhoods (40 per neighbourhood) about food security. Community groups run a food hub, a characteristic of the neighbourhood, in 20 of them, and a mixed model with no predictors gives an ICC of 0.05 for the food-security score. The standard error of the hub coefficient is 0.54 in lm() and 0.92 in lmer() with a random intercept for each neighbourhood. The analyst ran the lines below. What do they show?
lm(), which treats them as independent, is overconfident. A small ICC still matters when clusters are large (40 adults each), and a ratio of standard errors says nothing about the size of the estimate. (Section 1, 2.2 Cluster-Level and Person-Level Predictors and 3.1.2 The Design Effect and the Effective Sample Size; Objectives 2.2 and 3.1)✦ Before submitting: pass every section knowledge check (100%).