Generalized Linear Models
Exploratory Data Analysis For Epidemiology
Learning objectives for this lesson:
- Classify an outcome as continuous, count, binary, ordinal or nominal from what its values mean, and choose the matching regression model and the name of its exponentiated coefficient (a difference in means, an odds ratio, a relative risk ratio or an incidence rate ratio).
- Explain why binary, categorical and count outcomes break the assumptions of linear regression, identify which residual plot checks each assumption, and describe a generalized linear model by its distribution, link function and linear predictor.
- Interpret an odds ratio from a logistic regression with its confidence interval, explain why crude and adjusted odds ratios can differ, and judge whether a model has enough events per predictor.
- Explain why an ordinal outcome is analysed with ordinal logistic regression, interpret its odds ratios and predicted probabilities, and judge the proportional-odds assumption from a Brant test, naming what to do if it fails.
- Explain why a nominal outcome is analysed with multinomial logistic regression, interpret its relative risk ratios (naming both categories) and predicted probabilities, and explain the role of the reference category and the independence of irrelevant alternatives.
- Describe count outcomes and the Poisson distribution, interpret incidence rate ratios from a Poisson regression, and explain when an offset is needed and what the rate ratios then compare.
- Check a Poisson model for overdispersion with the dispersion ratio and the observed and expected zeros, explain what overdispersion does to standard errors, and choose between Poisson and negative binomial regression with these checks and the AIC.
This course was developed by Dr. Kiffer G. Card based on Dohoo, I. R., Martin, S. W., & Stryhn, H. (2012). Methods in Epidemiologic Research. VER Inc.
Glossary: Key Terms, People & Concepts
📚 Reference page, available throughout the lesson
This glossary collects the key concepts, methods and people in this lesson. It can be used as a reference while working through the material or as a review before assessments. Typing in the search box filters the entries.
lm(), and its coefficients are differences in means.
plot(model).
MASS::polr().
brant::brant().
nnet::multinom().
predict(model, newdata, type = "probs").
glm(family = poisson), and its exponentiated coefficients are incidence rate ratios.
MASS::glm.nb(), and its exponentiated coefficients are incidence rate ratios.
Analyzing Different Outcome Types Using GLMs
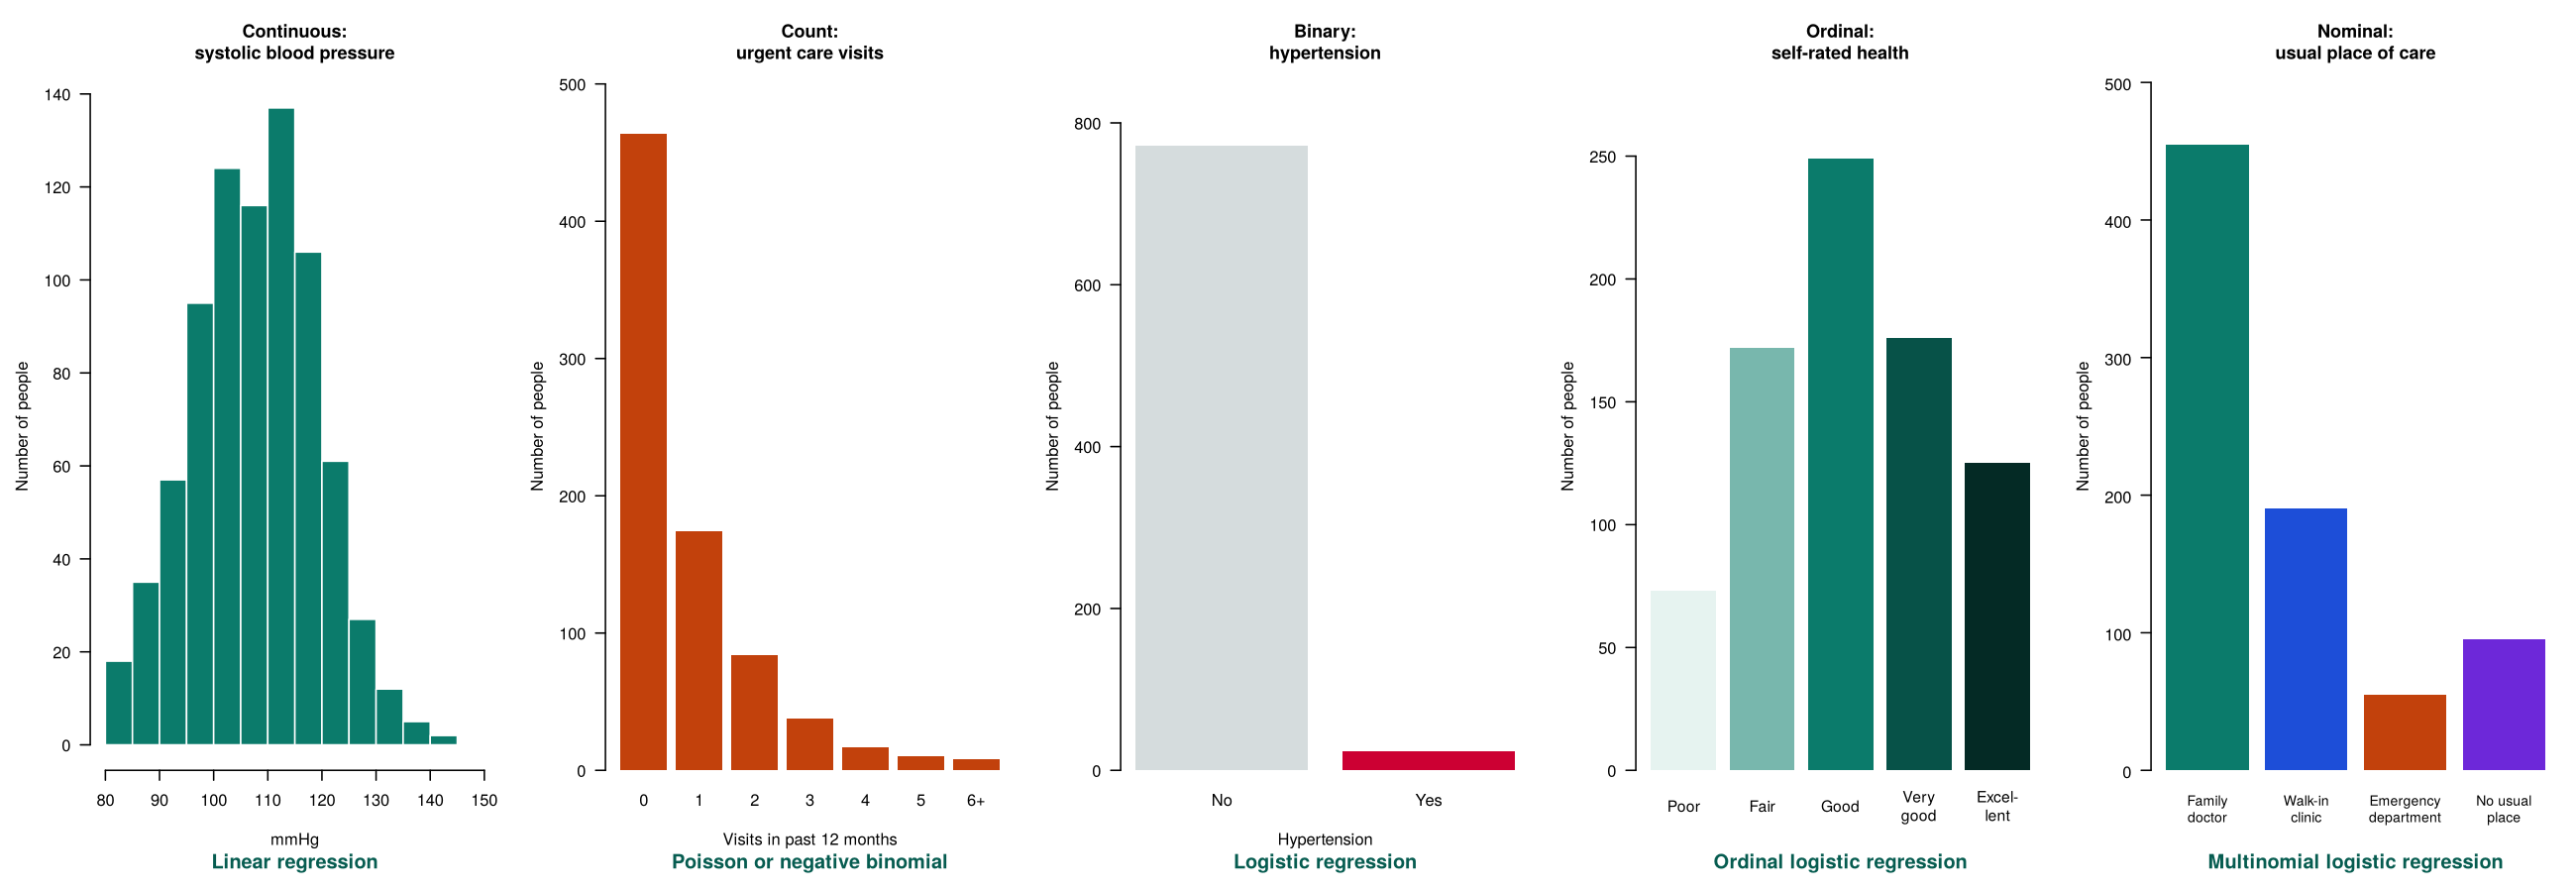
Five outcomes from the PHAA survey
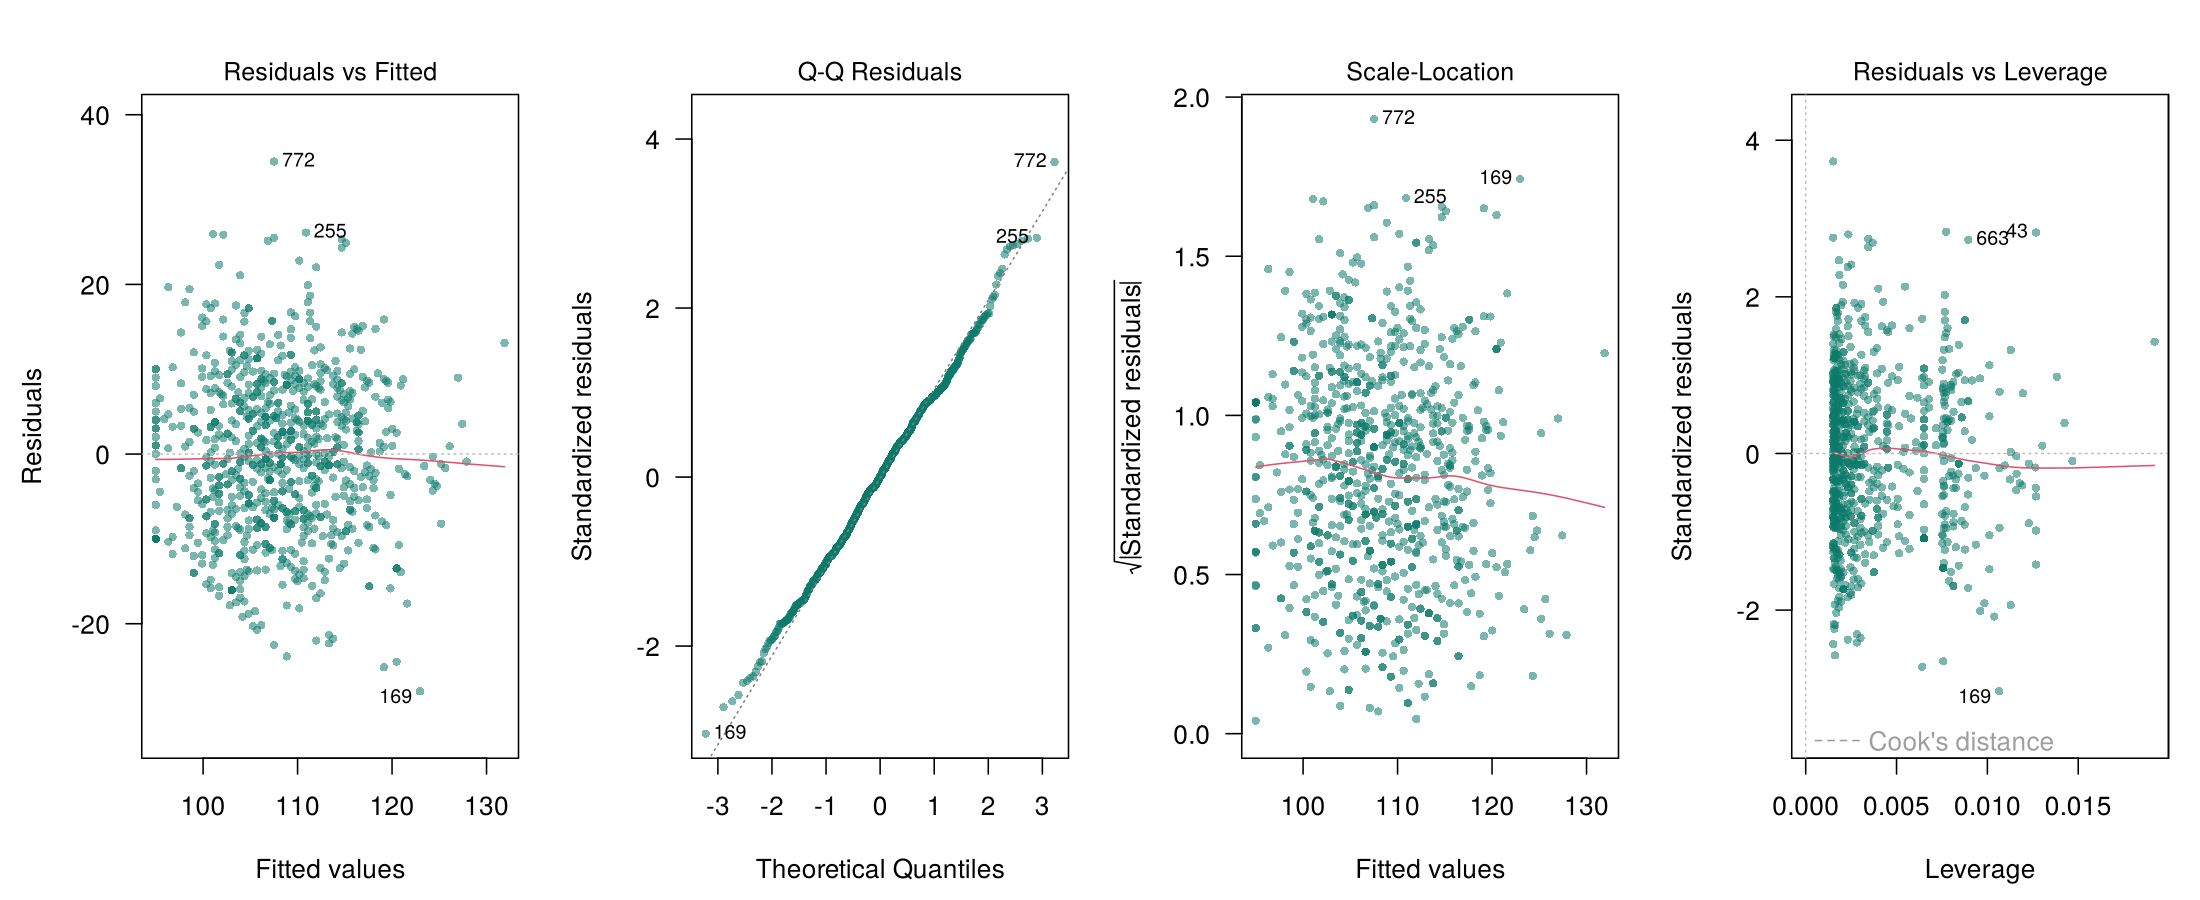
plot(lin) draws the four checks
Overview
Regression models describe how an outcome changes with one or more predictors. The two most familiar are linear regression for a continuous outcome and logistic regression for a binary (yes-or-no) outcome. Many outcomes in public health are neither continuous nor binary. Self-rated health is recorded in ordered categories, the place a person usually goes for care is a choice among unordered options, and the number of emergency visits is a count. This lesson presents one model for each of these outcome types. This first section shows how to classify a variable and match an outcome to its model, reviews linear regression and the assumptions on which it rests, explains why other types of outcome break those assumptions, and introduces generalized linear models (GLMs), the family to which every model in the lesson belongs. It closes with a review of logistic regression in R, the GLM for a binary outcome.
Learning Objectives
- 1.1 Classify a variable as continuous, discrete (count), binary, ordinal or nominal from what its values mean, rather than from how they are stored.
- 1.2 Match each outcome type to its regression model and say what the model's exponentiated coefficient is called.
- 2.1 State the four assumptions of linear regression and identify the plot from
plot(model), or the feature of the study design, that checks each one. - 2.2 Explain why binary, categorical and count outcomes break the assumptions of linear regression.
- 2.3 Describe the three parts of a generalized linear model: the distribution, the linear predictor and the link function.
- 3.1 Fit a logistic regression in R, interpret its odds ratios with their confidence intervals, compare crude and adjusted odds ratios, and check that there are enough events per predictor.
1.1 Types of Variables
Every variable in a dataset belongs to one of two families. Numeric variables record an amount. They are continuous when any value in a range is possible (blood pressure, body mass index, age measured precisely) and discrete when only whole numbers are possible (the number of visits, cases or falls). Categorical variables place each person into a group. They are nominal when the groups have no natural order (usual place of care, type of cancer, province of residence) and ordinal when the groups have a natural order (self-rated health, pain rated none to severe, stage of disease). A categorical variable with exactly two groups is called binary.
Table 4.1 lists the five types with the family to which each belongs and an example of each from the PHAA data, the survey used throughout this lesson.
Table 4.1. The five types of variable, grouped into two families, with an example of each from the PHAA data.
| Family | Type | What the values look like | Example in the PHAA data |
|---|---|---|---|
| Numeric | Continuous | Any value in a range, including decimals | systolic_bp (mmHg) |
| Numeric | Discrete (count) | Whole numbers 0, 1, 2, and so on | urgent_visits in the past 12 months |
| Categorical | Binary | Two groups | hypertension (No, Yes) |
| Categorical | Ordinal | Three or more groups with a natural order | self_rated_health (Poor to Excellent) |
| Categorical | Nominal | Three or more groups with no order | usual_care (Family doctor, Walk-in clinic, Emergency department, No usual place) |
The type of a variable is decided by what its values mean, and the way it is stored in a file can mislead. Self-rated health might be stored as the numbers 1 to 5, yet it is still ordinal, because the distance between "good" and "very good" is unknown. A postal code is made of characters and numbers, yet it is nominal. Click each of the five cards below to read a fuller description of each type, with further examples and the model that each type of outcome calls for.
As the cards show, each type of outcome has its own model, which is why classification comes first. Worked Example 4.1 applies the definitions to the outcomes of four studies planned by a health unit; notice that each type is decided from what the values mean, not from how they are recorded.
Worked Example 4.1: Classifying Four Outcomes
A health unit plans four studies. The first records the number of falls each resident of a care home has in a year, which is a count. The second records whether each resident was admitted to hospital (yes or no), which is binary. The third asks residents how often they feel lonely (never, sometimes, often), which is ordinal. The fourth records the main reason for admission (infection, injury, heart condition, other), which is nominal. Each study therefore needs a different model, even if the predictors are identical.
Worked Example 4.1 shows that four studies with identical predictors can need four different models, because their outcomes differ in type. The next step turns this observation into a guide for choosing a model.
1.2 Matching the Outcome to a Model
The choice of model follows from the type of the outcome, and the predictors play no part in it. The decision guide in Figure 4.1 can be worked through for any new outcome. The first question is whether the outcome is numeric or categorical, and the second question narrows the choice to one model. Follow each row of the guide from its question to the model it leads to.
Figure 4.1. A decision guide that leads from the type of the outcome to a model, with one column for numeric outcomes and one for categorical outcomes.
Each model also has a name for its result, and that name is part of matching the outcome to the model. A linear regression coefficient is a difference in means and is not exponentiated. The other models report exponentiated coefficients, which are ratios: logistic regression reports odds ratios, ordinal logistic regression reports odds ratios for being in a higher category, multinomial logistic regression reports relative risk ratios, and Poisson and negative binomial regression report incidence rate ratios. Why these coefficients are exponentiated is explained with generalized linear models in 2.3, where Table 4.2 sets out the whole pairing in one place.
With a model matched to each type of outcome, the next step is to look closely at the model for a continuous outcome, linear regression, and at the assumptions that the other models are designed to relax.
2.1 Linear Regression and Its Assumptions
Linear regression models the average of a continuous outcome as a straight-line function of the predictors. For systolic blood pressure (SBP) in the PHAA survey, with age and smoking as predictors, the model is written as in Equation 4.1.
When this model is fitted to the 795 people with complete data, the slope for age is 0.45 mmHg per year (95% CI 0.40 to 0.49) and the difference for smokers is 6.06 mmHg (95% CI 4.33 to 7.79). In R, lm() fits the model and confint() gives the intervals. The estimates can be trusted only if four assumptions are reasonable: linearity, independence, normality of the residuals and equal variance of the residuals, often remembered as LINE. A fifth check looks for single observations with too much influence. Three of the assumptions, and the check for influence, are read from the four plots that plot(model) draws, while independence is judged from the study design. Expand each panel below to see what the assumption means, how it is checked in R and what to do if it fails.
What it means. The average outcome changes in a straight line as each continuous predictor increases. Blood pressure should rise by about the same amount between ages 30 and 40 as between ages 60 and 70.
How to check it. In the Residuals vs Fitted plot from plot(model), the red smoothed line should be close to flat at zero. A clear curve (a U shape or an arch) suggests that the relationship is not a straight line.
If it fails. A squared term for the predictor, such as I(age^2), can capture a curve, and its coefficient tests whether the curve is needed.
What it means. Each person's outcome is unrelated to every other person's outcome once the predictors are taken into account.
How to check it. Independence is judged from the study design and cannot be read from a plot. It is usually reasonable when each person is sampled once. It fails when the same person is measured several times, or when people are clustered (patients within clinics, students within schools).
If it fails. Models for dependent data handle repeated or clustered measurements.
What it means. The residuals (each observed value minus the value predicted by the model) follow a roughly bell-shaped distribution. The assumption concerns the residuals, which are checked after the model is fitted, and a skewed outcome can still give normal residuals.
How to check it. In the Q-Q Residuals plot, the points should lie close to the dotted diagonal line. Small wiggles at the ends are common and are not a concern in a large sample.
If it fails. A strongly skewed outcome can sometimes be transformed (for example, by taking its log). If the outcome is a count or a category, a GLM from this lesson is the better choice.
What it means. The residuals are spread about equally across the whole range of predicted values. The technical name for this property is homoscedasticity.
How to check it. In the Residuals vs Fitted and Scale-Location plots, the band of points should have roughly the same height from left to right. A funnel that widens to one side is the usual sign of a problem.
If it fails. Sandwich (heteroscedasticity-consistent) standard errors or a transformation of the outcome can correct the problem. When the spread grows with the mean because the outcome is a count, a Poisson or negative binomial model is the better choice.
What it means. No single observation pulls the fitted line far from where the rest of the data would put it.
How to check it. In the Residuals vs Leverage plot, points that fall beyond the dashed Cook's distance lines have large influence. When no point is near them, R does not draw the lines inside the plotting area.
If it fails. The influential record is checked for a data-entry error. If it is a genuine value, the model is reported with and without it.
Figure 4.2 shows the four plots that plot(lin) draws for the blood pressure model, so that each of the checks described in the panels can be seen on real output.
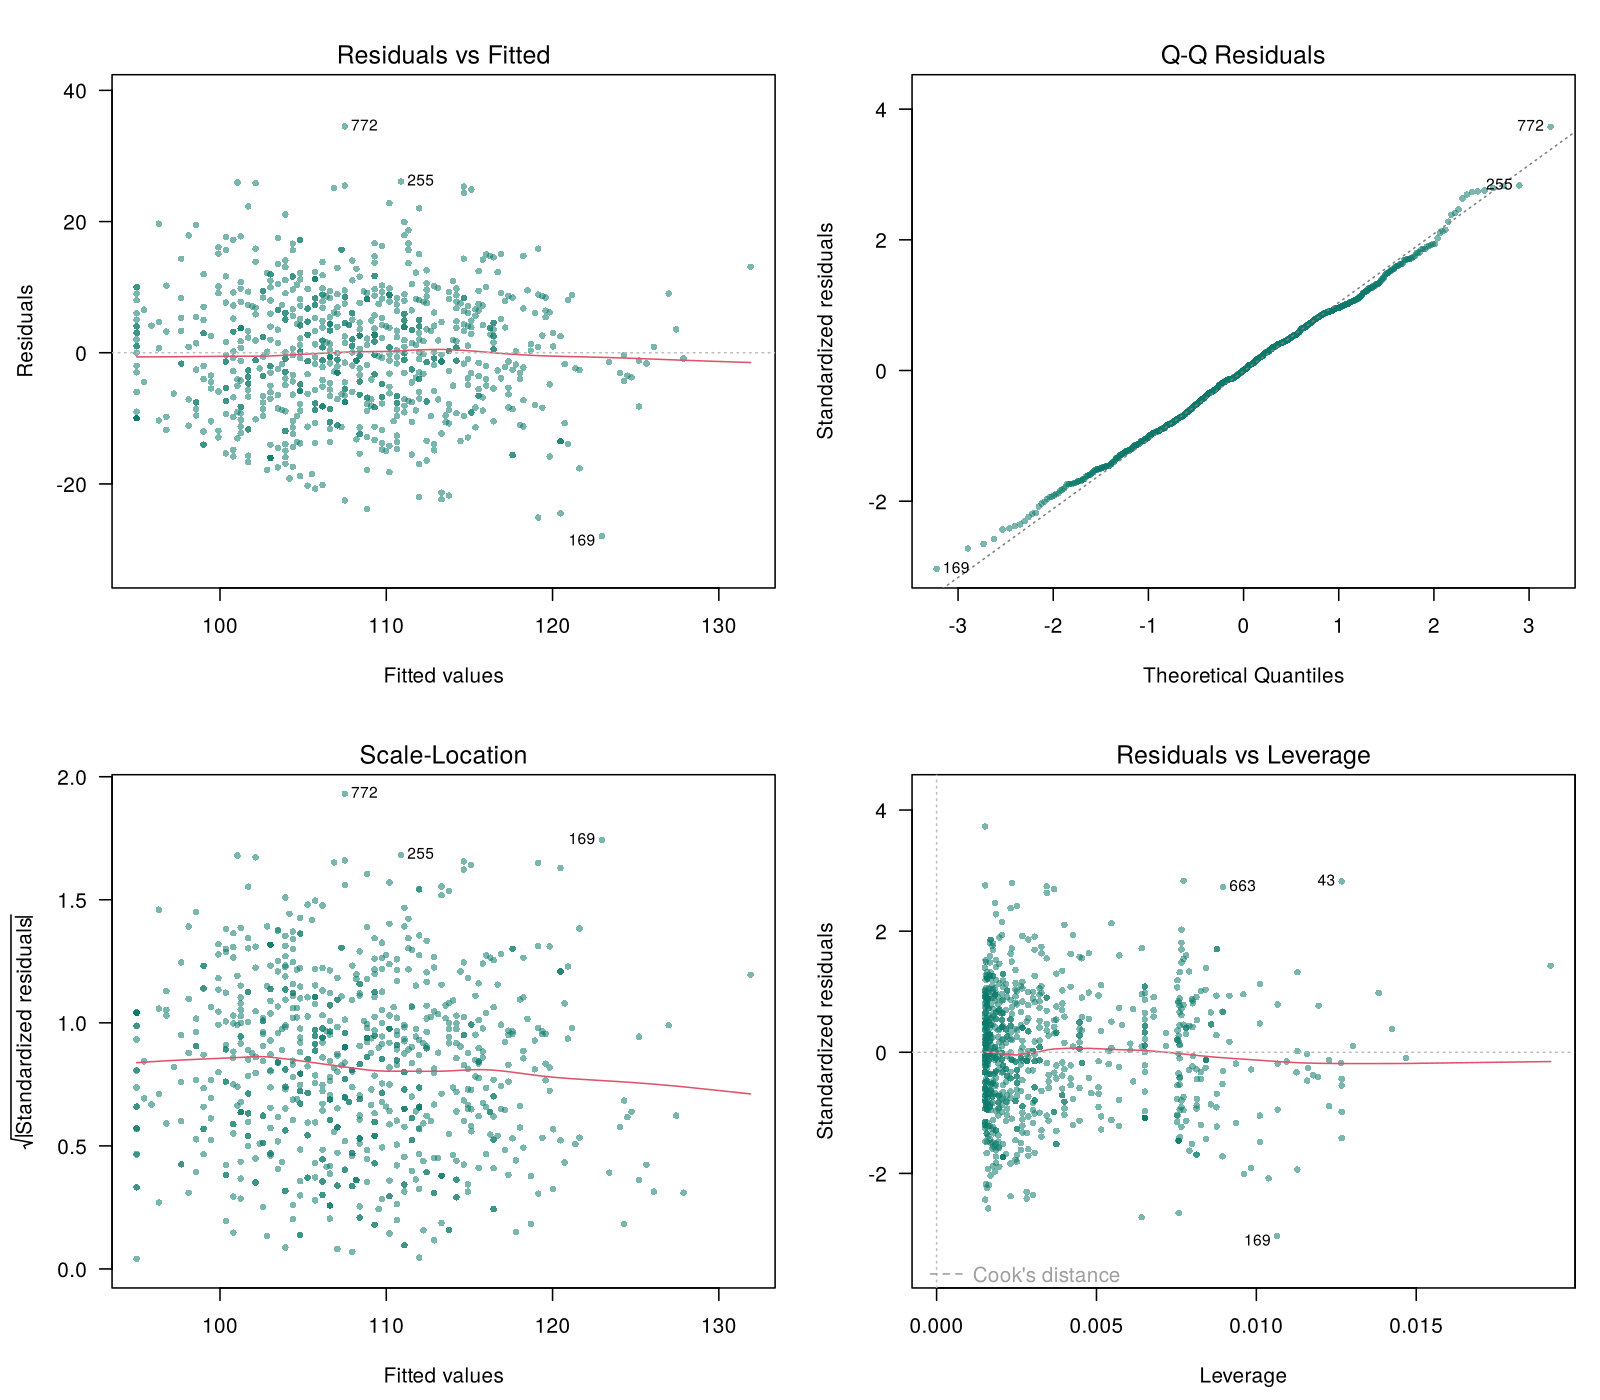
plot(lin) for the blood pressure model. The cloud of residuals is flat and even (linearity and equal variance), the points follow the Q-Q line (normality), and no point lies beyond Cook's distance (no overly influential points). In the first three panels the numbered points are the three largest residuals, and in Residuals vs Leverage they are the three largest Cook's distances; R labels them by row number.For the blood pressure model, the plots in Figure 4.2 support each of the assumptions that a plot can check. The next step is to see what the same plots look like when the outcome is not continuous.
2.2 Why Some Outcomes Break These Assumptions
The same four plots look very different when a straight line is fitted to an outcome that is a count. Figure 4.3 shows the first two plots for a linear regression of urgent_visits (the number of urgent care visits in the past year) on age and smoking.
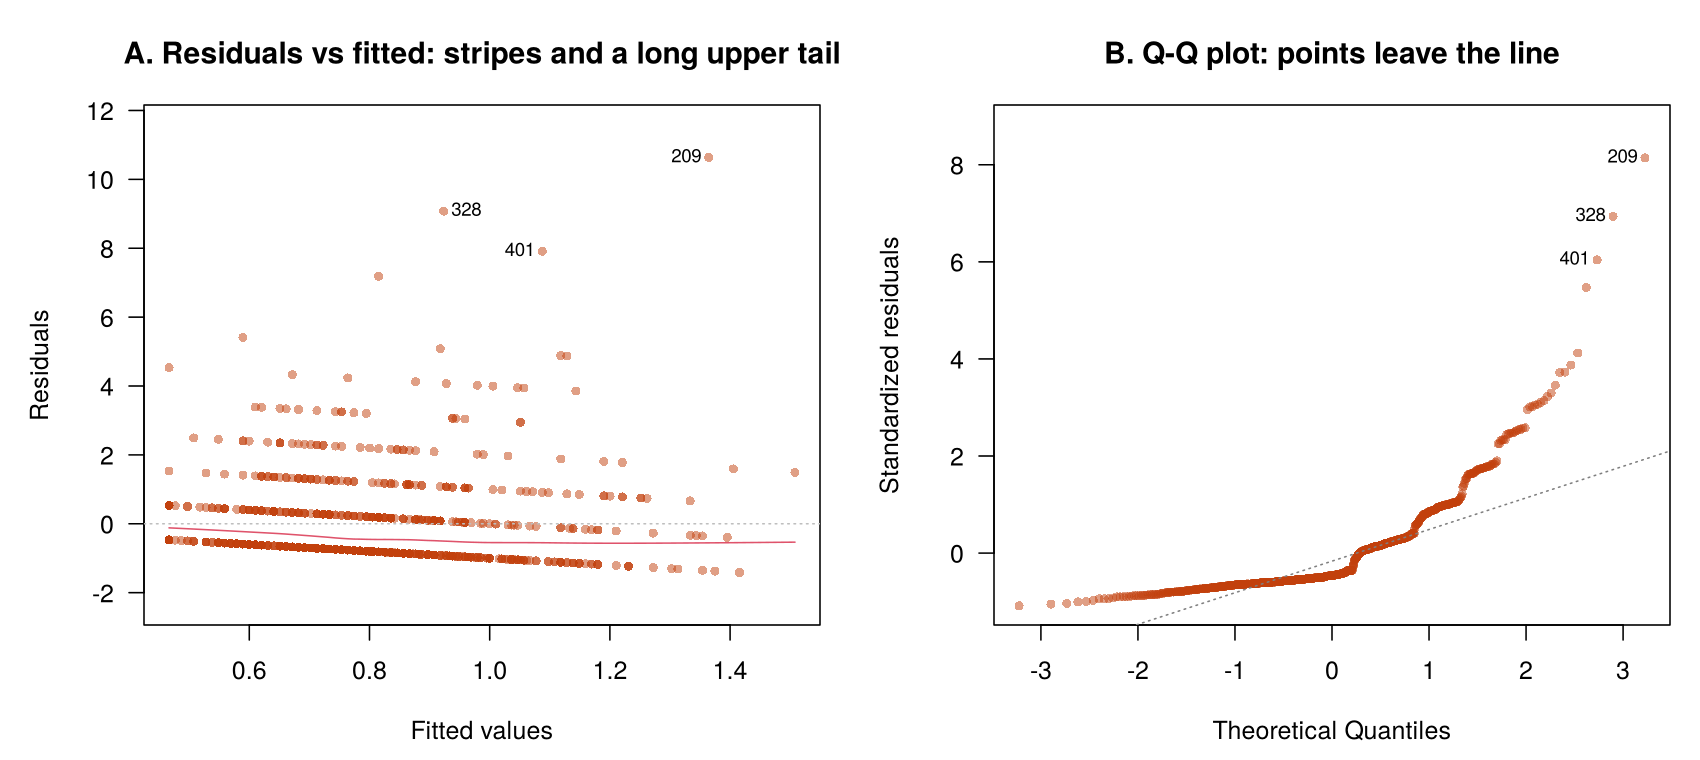
Each outcome type breaks the assumptions in its own way, and seeing how helps to explain why each needs its own model. A binary outcome takes only the values 0 and 1. A straight line has no floor or ceiling, so as a predictor such as age increases, the line keeps rising and can eventually predict a "probability" below 0 or above 1, which is impossible. The residuals are also unusual: for any person the residual can take only two values, one if they had the event and one if they did not, so the residuals form two bands rather than a bell-shaped spread and can never be normal. A count cannot be negative and often has many zeros, so its distribution is lopsided rather than bell-shaped. Counts also become more variable as their average increases. A group that averages 0.2 visits a year has little room to vary, while a group that averages 5 visits a year can range from 0 to 15 or more, so the spread of the residuals grows with the predicted value, which breaks the equal-variance assumption. An ordinal outcome has an order but no known spacing between its categories. If self-rated health is coded 1 to 5, a linear slope assumes that moving from "poor" to "fair" is the same size of change as moving from "very good" to "excellent", and nothing in the data supports that, so a slope "per category" has no clear meaning. A nominal outcome has no order at all, so any numbers attached to its categories are arbitrary labels, and a slope fitted to those labels would change if the categories were simply numbered in a different order.
Linear regression is therefore suited to a continuous outcome, and each of the other four types of outcome calls for a model that matches the values the outcome can take. The next step introduces the family of models that provides one for each type.
2.3 The Three Parts of a Generalized Linear Model
A generalized linear model (GLM) extends linear regression so that it can handle these outcomes. The extension was set out by Nelder and Wedderburn (1972) and is now the standard framework for regression in epidemiology. The central idea is that linear regression can be taken apart into pieces, and that only some of the pieces need to change for a new kind of outcome. Every GLM has three parts. The distribution (also called the family) describes the kind of values the outcome can take and how they vary around their average. A continuous outcome is described by the normal distribution, a binary outcome by the binomial distribution and a count by the Poisson distribution. The linear predictor is the familiar sum β0 + β1X1 + β2X2 + …, which combines the predictors exactly as in linear regression; this is the part that stays the same in every GLM, and it is why the models in this lesson are all written and fitted in a similar way. The link function is a transformation of the average outcome that is set equal to the linear predictor. It is the bridge between the two other parts, connecting the straight-line sum of the predictors to an average outcome that may be a probability or a count.
Equation 4.2 shows how the link function connects the average outcome to the linear predictor.
The link function is the part of a GLM that is least familiar, so it is worth slowing down. By setting a transformation of the average outcome equal to the linear predictor, we mean that the model does not draw its straight line on the outcome itself. Instead, it first transforms the average outcome onto a new scale and draws the straight line on that scale. The linear predictor can take any value from minus infinity to plus infinity, but many outcomes cannot. The transformation stretches the restricted range of the outcome onto that unlimited scale, so that whatever value the linear predictor produces, it translates back into an average that makes sense. Different models use different link functions, that is, different kinds of transformation, because different outcomes have different limits.
The purpose of the link is therefore to keep the model's predictions within a sensible range. For example, a probability must lie between 0 and 1, so when a model predicts a probability, as logistic regression does for a binary outcome, it uses the logit link, which guarantees that every predicted probability falls between 0 and 1. An expected count, such as the average number of urgent care visits, must stay positive and can never be negative, so when a model predicts an expected count, as Poisson regression does, it uses the log link, which guarantees that every predicted count is above 0. A continuous outcome such as blood pressure needs no protection of this kind, so linear regression uses the identity link, which leaves the average unchanged.
In addition to keeping predictions in range, the link also decides how the coefficients are read. In linear regression the identity link leaves the outcome on its own scale, so a coefficient is read directly as a difference in the average outcome: the slope of 0.45 for age in 2.1 means that average blood pressure is 0.45 mmHg higher for each additional year of age. With a log or logit link, such as those used in Poisson and logistic regression, the coefficient (written β) is on a log scale, and a difference on a log scale is hard to picture. When the coefficient is exponentiated, that is, when e is raised to the power of the coefficient (eβ, calculated with exp(coef(model)) in R or with the ex key on a calculator), it becomes a ratio: an odds ratio, a relative risk ratio or a rate ratio, depending on the model. This changes its interpretation. Instead of saying how much the outcome goes up or down, the ratio says how many times larger or smaller the odds, risk or rate is in one group than in another. With these ratios, a value of 1 means no association, because the two groups are the same. A ratio above 1 means the outcome is more likely or more frequent, and a ratio below 1 means it is less likely or less frequent.
Table 4.2 lists each model used in this lesson with its type of outcome, its distribution and link, the reading of eβ, and the R function that fits it. The note beneath the table explains how the ordinal and multinomial models relate to the GLM family.
Table 4.2. The regression models in this lesson, with the distribution, link, reading of eβ and R function of each.
| Model | Outcome | Distribution | Link | eβ is read as | R function |
|---|---|---|---|---|---|
| Linear regression | Continuous | Normal | Identity (no transformation) | Not exponentiated: β is a difference in means | lm() |
| Logistic regression | Binary | Binomial | Logit | Odds ratio (OR) | glm(family = binomial) |
| Ordinal logistic regression | Ordinal | Multinomial (ordered) | Cumulative logit | Odds ratio for a higher category | MASS:: |
| Multinomial logistic regression | Nominal | Multinomial | Logit versus a reference category | Relative risk ratio (RRR) | nnet:: |
| Poisson regression | Count | Poisson | Log | Incidence rate ratio (IRR) | glm(family = poisson) |
| Negative binomial regression | Overdispersed count | Negative binomial | Log | Incidence rate ratio (IRR) | MASS:: |
Strictly, the ordinal and multinomial models are close relatives of the GLM family (they are often called multivariate GLMs), because they model several probabilities at once. They are fitted and read in the same way, and this course treats them as members of the family.
Every model in Table 4.2 therefore keeps the linear predictor and differs in its distribution and link, and the link decides what its exponentiated coefficient is called. The rest of this section applies the framework to the GLM for a binary outcome, logistic regression.
3.1 Fitting and Interpreting a Logistic Regression
Logistic regression is the GLM for a binary outcome, with a binomial distribution and a logit link. It models the log of the odds of the event, and its exponentiated coefficients are odds ratios. In R it is fitted with glm(hypertension ~ age + smoker, data = phaa, family = binomial), and the line exp(cbind(OR = coef(logit), confint(logit))) in Activity 4.1 prints the odds ratios with their 95% confidence intervals. Reading those results, checking that the model has enough data, and comparing crude with adjusted estimates are taken in turn below.
3.1.1 Reading Odds Ratios and Their Confidence Intervals
Four statistical ideas from earlier courses are needed to read the results of every model in this lesson. Read the callout below to refresh them, and try its retrieval question before you read on.
Recall: Statistical Foundations
Four ideas are needed to read the results in this lesson.
Confidence intervals. A 95% confidence interval is a range of values calculated from the data. The method that produces it captures the true value in 95% of repeated samples, and the values inside it are those most compatible with the data. For a ratio, an interval that includes 1 shows that the data cannot rule out no association; for a difference, the corresponding value is 0.
p-values. A p-value is the probability of an estimate at least as far from “no association” as the one observed, if there were truly no association. A small p-value shows that the data are hard to reconcile with no association. It is not the probability that the null hypothesis is true, and it does not measure the size or importance of the association.
Probability and odds. The odds of an event are p ÷ (1 − p), the probability that it happens divided by the probability that it does not, and a probability is recovered as odds ÷ (1 + odds). When an event is rare, the odds and the probability are close.
Exponentiated coefficients. A log or logit link puts coefficients on a log scale. On that scale, effects add: each predictor adds its coefficient to the log-odds or log-rate. Exponentiating a coefficient (eβ) moves it back to the ordinary scale, where it becomes a ratio, such as an odds ratio, and effects multiply instead of add. An odds ratio of 1.5, for example, means that the odds are multiplied by 1.5. The two ends of the confidence interval are exponentiated in the same way, which is why an interval for a ratio is often not centred on its estimate.
Optional fuller reading: HSCI 341 Lesson 6, Section 4, and the confidence-interval paragraph of the mediation example in HSCI 410 Lesson 1, Section 1.
Retrieval question. In the paragraph that follows this callout, smokers have an odds ratio for hypertension of 2.65 (95% CI 1.04 to 6.30). What does the interval show?
In the PHAA data, R reports that the odds of hypertension are 2.65 times as high for smokers as for non-smokers of the same age (95% CI 1.04 to 6.30), and 1.05 times as high (about 5% higher) for each additional year of age (95% CI 1.01 to 1.08). Each odds ratio tells us by how much the odds of the event are multiplied, so a correct interpretation speaks of odds rather than risk. It also names the comparison group (non-smokers, or people one year younger) and the variables held constant (age for the smoking estimate, smoking for the age estimate), because an odds ratio has no meaning without knowing who is being compared with whom. The interval for smoking lies entirely above 1, so the data are hard to reconcile with no association, but it is wide. Only 23 of the 795 people have hypertension, and with so few events the model has little information about each predictor: the point estimate of 2.65 suggests a strong association, yet the data are consistent with anything from a very small increase to a six-fold increase in the odds. Reporting the interval alongside the estimate makes this uncertainty visible to readers.
The small number of events also limits how many predictors the model can support, which is one of the assumptions of logistic regression taken up next.
3.1.2 Assumptions and the Number of Events
The assumptions of logistic regression differ from those of linear regression, because a binary outcome has no normal residuals and no constant spread to check. Table 4.3 lists the assumptions of logistic regression with the way each is checked.
Table 4.3. The assumptions of logistic regression and how each is checked.
| Assumption | What it means | How to check it |
|---|---|---|
| Binary outcome | The outcome has exactly two categories. | table(outcome) shows two groups. |
| Independence | Each person contributes one independent observation. | Judged from the study design. |
| Linearity in the log-odds | Each continuous predictor has a straight-line relationship with the log-odds of the event. | Add a squared term (for example I(age^2)) and check whether it improves the model. |
| Enough events | A common rule of thumb asks for about 10 events per predictor. | table(outcome) gives the number of events. With 23 events, about two predictors are supported. |
| No strong multicollinearity | Predictors are not so strongly related that their effects cannot be separated. | Correlations among predictors, or variance inflation factors. |
The rule of about 10 events per predictor in Table 4.3 matters in the PHAA data, because few participants have hypertension. The rule counts the events, the people with the outcome, not everyone in the sample: table(phaa$hypertension) in Activity 4.1 shows 23 events, enough for about two predictors. The model with age and smoking is therefore close to the limit, and adding more predictors would make the estimates unstable and their intervals wider still.
A model that has been fitted and checked is then reported, usually in a table that also shows how much adjustment changed each estimate.
3.1.3 Crude and Adjusted Odds Ratios
Published papers usually report a regression in a table that sets the crude (unadjusted) estimate for each predictor beside the adjusted estimate from the multivariable model, so that readers can see how much adjustment changed each association. The crude odds ratio for a predictor comes from a logistic model with that predictor alone, such as glm(hypertension ~ smoker, data = phaa, family = binomial), and the adjusted odds ratios come from the model with age and smoking together. Table 4.4 shows this layout for the PHAA example.
Table 4.4. Crude and adjusted odds ratios for hypertension in the PHAA example.
| Predictor | Crude OR (95% CI) | Adjusted OR (95% CI) |
|---|---|---|
| Age (per year) | 1.05 (1.01 to 1.08) | 1.05 (1.01 to 1.08) |
| Smoker (yes vs. no) | 2.76 (1.09 to 6.50) | 2.65 (1.04 to 6.30) |
Odds ratios for hypertension among the 795 PHAA participants with complete data (23 events). The adjusted odds ratios come from one logistic regression that includes age and smoking. The 95% confidence intervals come from confint().
A clear results table states the outcome, the number of people and events, the reference category of each categorical predictor, the unit of each continuous predictor and the variables in the adjusted model. In this example adjustment changes the smoking odds ratio only slightly, from 2.76 to 2.65, because smokers and non-smokers in these data have almost the same average age (45.5 and 45.1 years).
The crude and adjusted odds ratios can differ much more when another predictor is related both to the predictor of interest and to the outcome. Suppose smokers in another study were on average ten years older than non-smokers, and older people had more hypertension. Part of the crude odds ratio for smoking would then reflect age rather than smoking, and adjusting for age would move the odds ratio toward 1. A large change between the crude and adjusted estimates is therefore a sign of confounding by the variables added to the model, and a small change, as here, shows that those variables barely distort the association.
Activity 4.1 puts this review into practice. It shows why a straight line does not suit a yes-or-no outcome, then fits the logistic model for hypertension as a generalized linear model and produces the odds ratios and the crude and adjusted comparison in Table 4.4. Run the script alongside the reading and answer the questions from your own output.
Text version of the activity: the code of the run-along script, its console output and notes on reading it.
phaa <- read.csv("https://heal-learn.ca/r-activities/data/phaa_outcomes.csv")   # course data, read from the website
phaa <- na.omit(phaa)                   # keep the 795 people with no missing values
phaa$smoker <- factor(phaa$smoker, levels = c("No", "Yes"))   # "No" = reference
phaa$hypertension <- factor(phaa$hypertension, levels = c("No", "Yes"))   # "Yes" = event
table(phaa$hypertension) # how many people had the event?The table is the first check for a logistic regression: 23 of the 795 people have hypertension, and these events limit how many predictors the model can support.
lin01 <- lm(as.numeric(hypertension == "Yes") ~ age + smoker, data = phaa)
range(fitted(lin01))         # the "probabilities" a straight line predicts
plot(lin01, which = 1)       # Residuals vs Fitted for a 0/1 outcome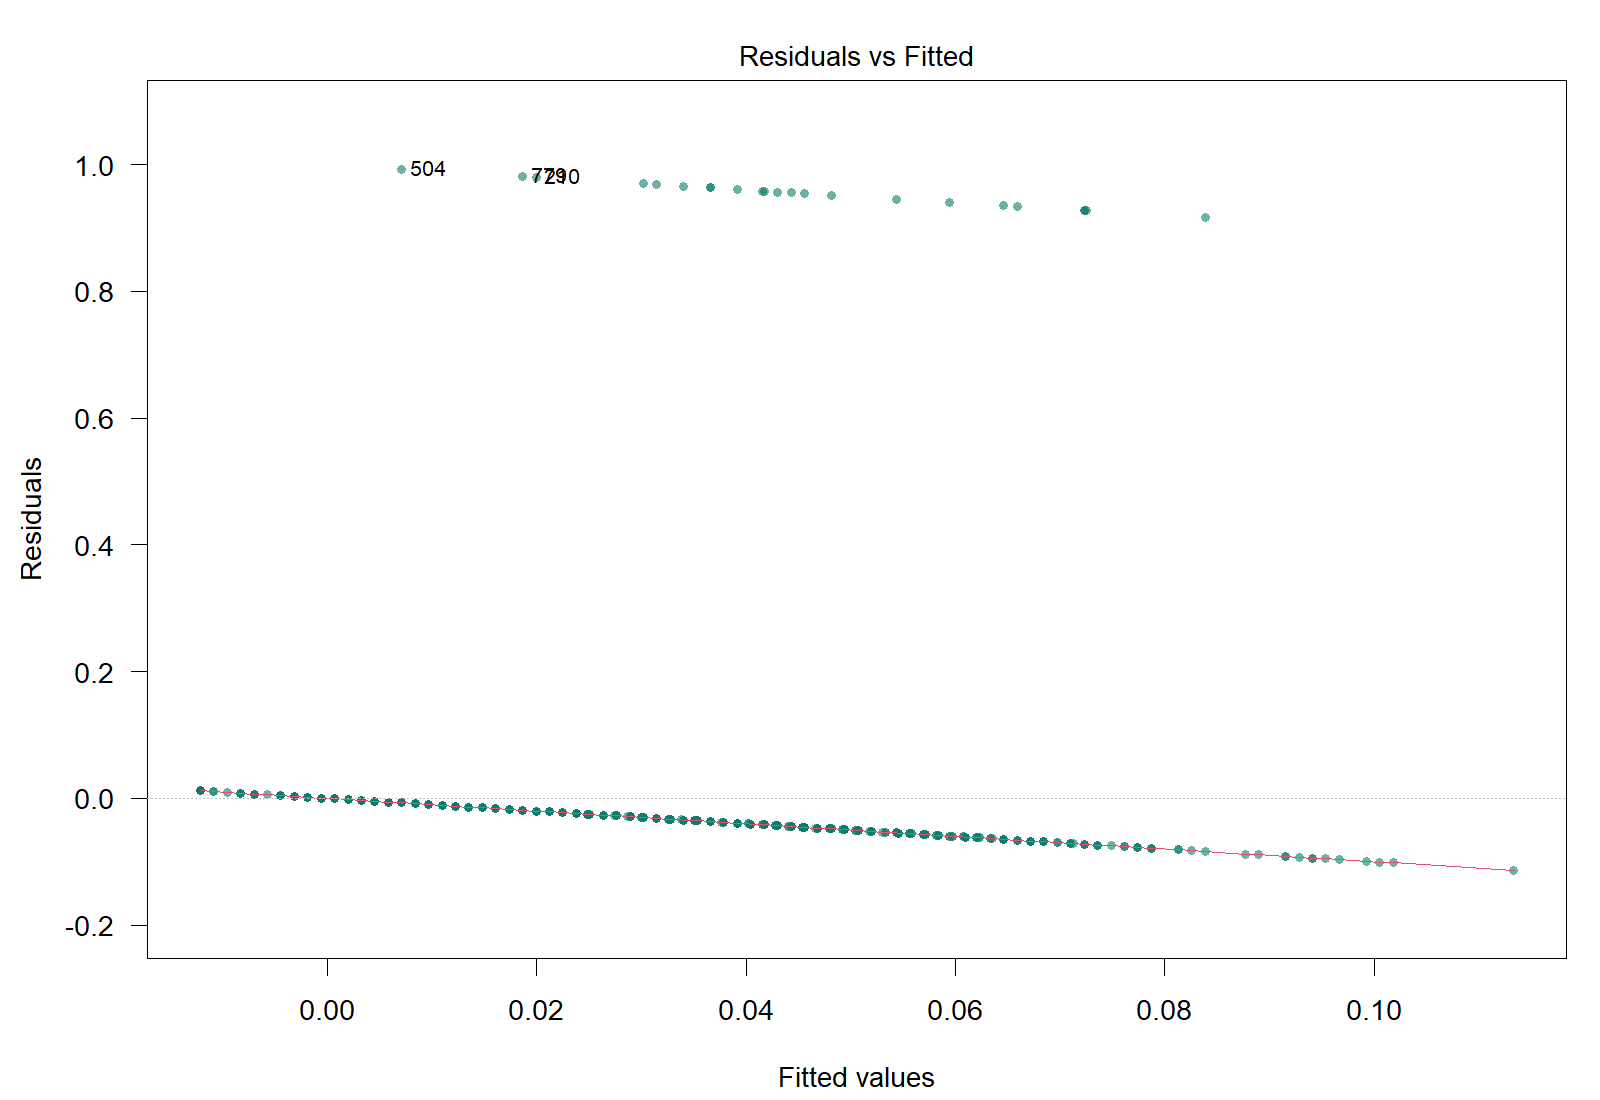
A straight line fitted to the 0/1 outcome predicts values below 0 for some people (64 of them), and its residuals fall on two parallel bands, one for each outcome (the Residuals vs Fitted plot above).
logit <- glm(hypertension ~ age + smoker, data = phaa, family = binomial)
summary(logit)
exp(cbind(OR = coef(logit), confint(logit))) # odds ratios with 95% CIsReading the output. The Estimate column is on the log-odds scale, so the last line exponentiates the coefficients to give odds ratios. family = binomial gives the outcome a binomial distribution with the logit link, and age and smoking form the linear predictor. The odds ratio for age is 1.045 (95% CI 1.014 to 1.078), and the odds ratio for smoking is 2.65 (95% CI 1.04 to 6.30). The odds ratio for the intercept is the odds of hypertension for a non-smoker aged 0 and is not interpreted.
crude <- glm(hypertension ~ smoker, data = phaa, family = binomial)
exp(cbind(OR = coef(crude), confint(crude)))The crude odds ratio for smoking, from a model with smoking alone, is 2.76 (95% CI 1.09 to 6.50).
R Reflect on what you just ran
Answer each question from your own output, as on the final exam: find the number, say what it means, judge the check.
1. Why is logistic regression, rather than linear regression, suitable for hypertension? Use range(fitted(lin01)) and the Residuals vs Fitted plot to give two reasons why a straight line does not suit it.
2. Interpret the odds ratio for smokerYes, with its confidence interval. Without adjustment (crude) the odds ratio is 2.76; after adjustment for age it is 2.65. Explain why the two odds ratios are so similar.
3. Run your own code: at the end of the script, type exp(10 * coef(logit)["age"]), exp(10 * confint(logit)["age", ]) and sum(phaa$hypertension == "Yes") / 5 and run them. Interpret the odds ratio for a ten-year difference in age, with its confidence interval. The model has 23 events, and the last line gives the number of events per predictor if BMI, gender and income were added as three more predictors (five in all). Is that enough?
Your output from Activity 4.1 reproduces the odds ratios in Table 4.4 and the count of 23 events that limits the model. The key takeaways below draw the section together before its knowledge check.
Key Takeaways
- 1.1 Variables come in different types depending on what their values represent. This lesson uses five main types, continuous, discrete (count), binary, ordinal and nominal, which fall into a numeric family and a categorical family (Table 4.1). You are not always able to tell a variable's type simply from how it is stored. Both continuous and ordinal variables may use numbers (self-rated health might be stored as 1 to 5, yet it is still ordinal, because the distance between "good" and "very good" is unknown), and binary and nominal variables are sometimes stored as numeric codes too. You must consult the data dictionary and the question text to understand what the values stored in a dataset represent. The
class()function can tell you what type R has assigned to a variable, but R's label is not always the right type for your analysis. - 1.2 Once you know the type of the outcome, the model follows from it, and the predictors play no part in the choice. A continuous outcome calls for linear regression, a binary outcome for logistic regression, ordered categories for ordinal logistic regression, unordered categories for multinomial logistic regression, and a count for Poisson regression, or negative binomial regression when the counts are overdispersed. The model also tells you what its results are called: a linear regression coefficient is a difference in means and is not exponentiated, while the exponentiated coefficients of the other models are odds ratios (logistic and ordinal), relative risk ratios (multinomial) or incidence rate ratios (Poisson and negative binomial). When a question gives you several outcomes, work through Figure 4.1 for each one in turn: decide whether it is numeric or categorical, narrow it to one model, and write the model and the name of its ratio together. Table 4.2 sets out the whole pairing in one place.
- 2.1 Linear regression rests on four assumptions, often remembered as LINE: linearity, independence, normality of the residuals and equal variance of the residuals. Three of them can be checked from the four plots that
plot(model)draws. A flat red line in Residuals vs Fitted supports linearity, points close to the diagonal in Q-Q Residuals support normality, and an even band with no funnel in Scale-Location supports equal variance, while Residuals vs Leverage flags influential points beyond Cook's distance. Independence cannot be read from any plot: you judge it from the study design, so look in the question for the same person measured several times or for people clustered in clinics, schools or households. Remember too that normality concerns the residuals, not the raw outcome, so a skewed outcome does not by itself break the assumption. - 2.2 Linear regression suits a continuous outcome, and each of the other outcome types breaks its assumptions in its own way. A straight line fitted to a binary outcome can predict impossible probabilities below 0 or above 1, and its residuals can never be normal. A count cannot be negative, often has many zeros and becomes more variable as its average rises, so its residuals are skewed and their spread grows with the fitted values. An ordinal outcome has an order but no known spacing, so a slope "per category" has no clear meaning, and the numbers attached to a nominal outcome are only labels. When you are shown residual plots for a count, as in Figure 4.3, look for stripes of residuals, a Q-Q plot that bends away from the line and a Scale-Location line that climbs, and name the assumptions they break before you name the better model.
- 2.3 A generalized linear model (GLM) keeps the familiar linear predictor, β0 + β1X1 + β2X2 + …, and changes two things: the distribution (or family), which describes the kind of values the outcome can take, and the link function, which transforms the average outcome so that it can be set equal to the linear predictor. The link keeps predictions in a sensible range, because the logit keeps probabilities between 0 and 1 and the log keeps expected counts positive. It also decides how you read a coefficient: with a log or logit link, β is on a log scale, so you exponentiate it with
exp(coef(model))to get a ratio, on which 1 means no association. If you are asked to describe a GLM, name all three parts for that model, for example a binomial distribution, a logit link and age plus smoking as the linear predictor for the logistic model of hypertension. - 3.1 Logistic regression models the log odds of a binary outcome, so after you fit it with
glm(…, family = binomial), the lineexp(cbind(OR = coef(logit), confint(logit)))turns its coefficients into odds ratios, each of which multiplies the odds of the event. Read every odds ratio with its 95% confidence interval: smokers in the PHAA data have 2.65 times the odds of hypertension of non-smokers of the same age (95% CI 1.04 to 6.30), and because the interval lies entirely above 1 the data are hard to reconcile with no association, although its width shows that the estimate is imprecise. Then compare the crude odds ratio, from a model with that predictor alone, with the adjusted one: a large change signals confounding by the variables added, while a small change, such as 2.76 to 2.65 here, shows that they barely distort the association. Before you trust the model, count the events withtable(outcome)and allow about 10 per predictor, so the 23 cases of hypertension support only about two predictors. In your interpretation, speak of odds rather than risk, and name the comparison group and the variables held constant.
1. A health unit's survey file stores the four outcomes below as numbers. Which analysis plan matches each outcome to the right model and to the name of its exponentiated coefficient?
| Variable | Stored as | What the values mean |
|---|---|---|
er_visits | 0, 1, 2, … | Emergency department visits in the past year |
food_sec | 1 to 4 | 1 = food secure, 2 = marginally, 3 = moderately, 4 = severely food insecure |
transport | 1 to 4 | Main way of getting to work: 1 = car, 2 = public transit, 3 = walking, 4 = cycling |
flu_vax | 0 or 1 | Received an influenza vaccine this season (1 = yes) |
er_visits, ordinal logistic regression for food_sec, multinomial logistic regression for transport and logistic regression for flu_vax. The information needed is what each set of values means, not how it is stored: er_visits counts events (whole numbers of 0 or more), so it is a count and its model reports incidence rate ratios; food_sec has four categories in a natural order with unknown spacing, so it is ordinal; transport has four categories with no order (cycling is not "more" than walking), so it is nominal; and flu_vax has two groups, so it is binary. The tempting plan that uses linear regression for food_sec and transport treats the codes 1 to 4 as amounts when they are only labels, and the plan that swaps the ordinal and multinomial models follows the order of the codes rather than the meaning of the categories. (Section 1, 1.1 Types of Variables, Table 4.1 and the five flip cards, and 1.2 Matching the Outcome to a Model, Figure 4.1; Objectives 1.1 and 1.2)2. A study measures body mass index (BMI) in 640 adults recruited as couples, two adults from each of 320 households, and fits lm(bmi ~ age + income + smoker). In the plots from plot(model), the red line in Residuals vs Fitted is flat at zero, the points in Q-Q Residuals lie close to the diagonal, the band of points in Scale-Location widens from left to right while its red line climbs, and no point in Residuals vs Leverage lies beyond Cook's distance. Which conclusion is correct?
3. In a study of 600 children with asthma, 62% had no asthma attacks needing urgent care in the past year, a few had as many as 9, and the mean was 0.7. A colleague plans to fit lm(attacks ~ age + smoke_home). Which reply is correct?
4. A survey of 900 adults recorded whether each had gone two years without a dental visit (no_dental = 1 for 210 adults). A logistic regression included insured (1 = has dental insurance), income10 (household income per $10,000), age10 (age per 10 years) and female (1 = woman), and gave the odds ratios below. Which interpretation is correct?
5. In the same survey, insured fitted on its own gave a crude odds ratio of 0.38 (95% CI 0.28 to 0.53), against the adjusted 0.52 in Question 4. Insured adults had higher incomes, and higher income was linked to lower odds of going without a dental visit. R gives the events and the events per predictor for the four-predictor model below. Which statement is correct?
table()), and R gives 52.5 events for each of the four predictors, far more than about 10, so the estimates should be stable. The tempting first option counts all 900 adults rather than the 210 events, and dropping insurance would be wrong, because its adjusted odds ratio (0.52, 95% CI 0.37 to 0.73) is still clearly below 1. (Section 1, 3.1.2 Assumptions and the Number of Events, Table 4.3, and 3.1.3 Crude and Adjusted Odds Ratios, Table 4.4; Objective 3.1)6. A cardiac rehabilitation program surveyed 900 adults and recorded angina, the number of episodes of chest pain each adult had in the same four weeks (0 to 15, with most adults at 0 or 1). A colleague fitted lm(angina ~ age + smoker). In the plots from plot(model), the points in Q-Q Residuals bend away from the line at the upper end, and the band of points in Scale-Location widens to the right. Which reply is correct?
urgent_visits. A GLM keeps the linear predictor and changes the other two parts: Poisson regression uses a Poisson distribution and a log link, so the expected count stays positive and eβ is an incidence rate ratio. Independence is judged from the study design rather than from these plots, a squared term addresses linearity, which the plots described do not question, and the estimates of a model can be trusted only if its assumptions are reasonable, however small the p-values. Logistic regression is the model for a binary outcome, not a count. (Section 1, 2.1 Linear Regression and Its Assumptions and its accordion panels, 2.2 Why Some Outcomes Break These Assumptions and Figure 4.3, and 2.3 The Three Parts of a Generalized Linear Model, Table 4.2; Objectives 2.1, 2.2 and 2.3)Ordinal Logistic Regression
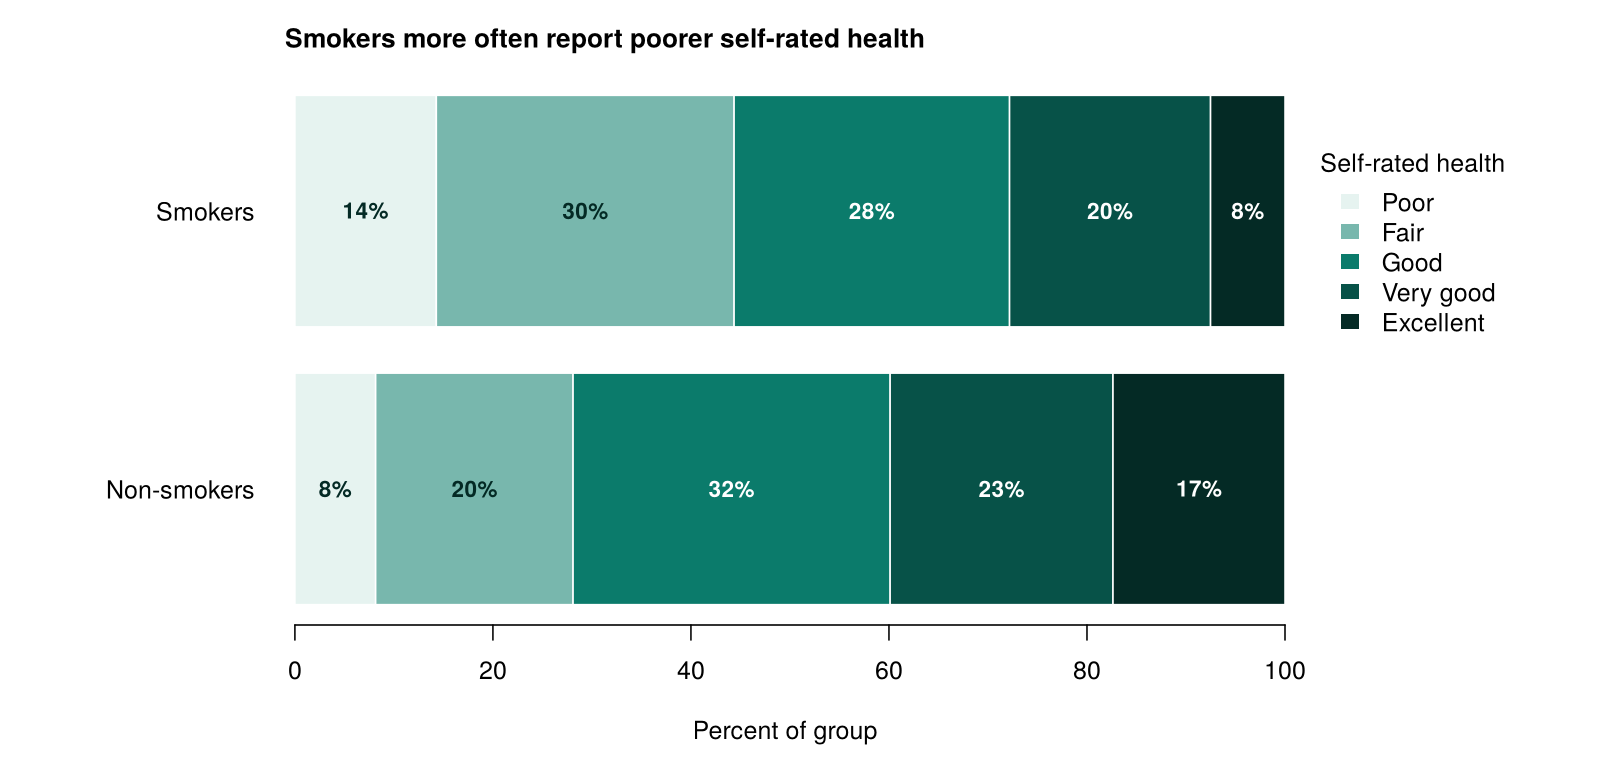
Self-rated health by smoking
Overview
This section presents ordinal logistic regression, the model for an outcome with three or more ordered categories. The running example is self-rated health, a widely used single question in health surveys that asks people to rate their own health as poor, fair, good, very good or excellent. Self-rated health predicts later death even after other measures of health are taken into account (Idler & Benyamini, 1997), which makes it a common outcome in public health research. In the PHAA data, self-rated health is a simulated variable added for this lesson. The section explains why the common shortcuts for such an outcome lose information, shows how the model compares the categories through a series of splits, fits it with age and smoking as predictors, describes its predicted probabilities for two people and checks the assumption that sets it apart.
Learning Objectives
- 4.1 Recognize an ordinal outcome and explain why linear regression and binary logistic regression are poor choices for it.
- 4.2 Describe how the ordinal model compares "at or above" with "below" at each split of the outcome.
- 4.3 Fit an ordinal logistic regression in R with
polr(), interpret its odds ratios as applying at every split, and judge their statistical significance from their confidence intervals. - 4.4 Describe the predicted probabilities from the model for two people in plain words.
- 4.5 Check the proportional-odds assumption with the Brant test and name what to do if it fails.
4.1 What Makes an Outcome Ordinal?
An outcome is ordinal when its categories can be ranked but the distances between them are unknown. Self-rated health, pain severity, agreement scales, disease stage and education level are all ordinal. The defining feature is that the order carries information: a move from "good" to "very good" is a move in a known direction. What the order does not say is how large each move is. The step from "poor" to "fair" might reflect a much larger change in health than the step from "very good" to "excellent", and the data offer no way to measure the difference.
Two shortcuts are common in practice, and both lose something. Coding the categories as 1 to 5 and fitting a linear regression treats every step as equal and assumes normal residuals, which a five-category outcome cannot have. Collapsing the categories into two groups and fitting a logistic regression discards the detail within each group and makes the result depend on where the cut-off is placed. Ordinal logistic regression avoids both problems.
Click each of the three cards below to compare the two shortcuts with ordinal logistic regression, and to see what each approach assumes and what it loses.
Ordinal logistic regression keeps every category and uses their order. The next step shows how it does this by fitting a series of splits of the outcome.
4.2 How the Model Works: A Series of Splits
The ordinal model works by turning one ordered outcome into several yes-or-no questions. Imagine drawing a line between two neighbouring categories of self-rated health and asking, for each person, whether their answer falls at or above the line or below it. With five ordered categories there are four places to draw the line, and in general an outcome with K ordered categories has K − 1 such splits. Each split is a yes-or-no comparison, so each one could be handled on its own by a binary logistic regression of the kind reviewed in 3.1. Rather than fitting four separate models and reporting four sets of results, the ordinal model fits the four comparisons together in a single model.
Figure 4.4 shows the four splits for self-rated health.
Figure 4.4. The four splits of the five categories of self-rated health, each comparing the categories at or above the split with those below it.
Fitting the splits together requires the model to decide what is allowed to differ between them and what is shared. The intercepts differ: the model gives each split its own intercept, because the proportion of people at or above the line changes depending on where the line is drawn. Almost everyone is "fair or better", so the odds at split 1 are high, while only a small share is "excellent", so the odds at split 4 are low. The predictors, however, are shared. Each predictor receives a single coefficient that applies to every split, which means the model assumes that smoking, for example, changes the odds of being above the line by the same amount wherever the line is drawn. Because the odds for smokers and non-smokers stay in the same proportion at every split, the model is called the proportional-odds model. This is a real assumption about the data rather than a mathematical convenience, and it is the assumption that the Brant test checks in 4.5 (McCullagh, 1980).
Equation 4.3 writes the model for self-rated health with age and smoking as predictors.
Worked Example 4.2 shows what the single coefficient replaces. It sets the crude odds ratio for smoking at each of the four splits in Figure 4.4, as R reports it, beside the one odds ratio that the model estimates; watch whether the four values agree.
Worked Example 4.2: The Four Splits Side by Side
Fitting a separate binary logistic regression of each split on smoking alone gives the crude odds ratio at that split. The code below does this for the four splits, the same approach that Activity 4.2 uses with age added, and R prints one odds ratio for each split.
Each value compares the odds of being at or above a split for smokers with the same odds for non-smokers. The value of 0.49 printed under Good, for example, is the odds ratio for split 2: smokers have about half the odds of non-smokers of rating their health as good or better rather than poor or fair. A value below 1 at every split means that smokers are less likely than non-smokers to be at or above each split.
The four crude odds ratios are similar, and they all point in the same direction. The ordinal model replaces them with one number, 0.50, which also adjusts for age. The Brant test asks whether the four split-specific values differ by more than chance would produce.
Worked Example 4.2 shows that one odds ratio can summarise all four splits when the split-specific values agree. The next step reads that single odds ratio, and the rest of the output, from the model fitted to the PHAA data.
4.3 Interpreting the Odds Ratios
Before any odds ratio from polr() is read, its direction has to be settled, because textbooks and software do not all write the model the same way. The caution below sets out the convention that R uses.
How R Writes the Ordinal Model
Some textbooks and software write the ordinal model the other way round, as the odds of being at or below a category, which flips the sign of every coefficient. R's polr() is set up so that a positive coefficient means that higher categories are more likely and a negative coefficient means that lower categories are more likely. With self-rated health ordered from Poor to Excellent, an odds ratio below 1 therefore means poorer reported health. The order of the levels in factor() decides which end of the scale counts as "higher", so it is worth checking that order before reading any result. R also prints the intercepts (cut-points) with the opposite sign to β0j in Equation 4.3, so they cannot be substituted into that formula directly.
Fitted to the 795 people in the PHAA data, the ordinal model gives an odds ratio for smoking of 0.50 (95% CI 0.36 to 0.70). Self-rated health is ordered from Poor to Excellent, so a value below 1 points toward poorer reported health. In words, smokers have about half the odds of non-smokers of the same age of reporting a higher category of self-rated health. Because the model applies this one odds ratio at every split, the statement holds wherever the line is drawn: smokers have about half the odds of being fair or better rather than poor, about half the odds of being good or better rather than fair or poor, and so on up to excellent. The interval of 0.36 to 0.70 lies entirely below 1, so the data are hard to reconcile with no association. The odds ratio for age is 0.966 per year (95% CI 0.957 to 0.975). Because one year is a small step, the odds ratio for ten years is easier to picture. R gives it with exp(10 * coef(ord)["age"]), which prints 0.71 (Activity 4.2): a person ten years older has about 29% lower odds of reporting a higher category, for the same smoking status.
Figure 4.5 shows the distribution of self-rated health among non-smokers and smokers that lies behind the odds ratio for smoking.
The output of polr() also lists four intercepts, labelled Poor|Fair, Fair|Good, Good|Very good and Very good|Excellent. These are the cut-points between neighbouring categories, that is, the split-specific intercepts described in 4.2, and each one marks where the line between two categories falls on the log-odds scale. predict() uses them to work out predicted probabilities, but they describe the outcome rather than the effect of any predictor, so they are not usually reported or interpreted. Unlike glm(), polr() prints t values but no p-values. This is not a problem, because the 95% confidence intervals from confint() answer the same question. When an interval for an odds ratio excludes 1, the value that means no association, the association is statistically significant at the 5% level; when the interval includes 1, the data cannot rule out no association.
The odds ratio of 0.50 summarises the shift in Figure 4.5 in a single number, but many readers find odds ratios hard to picture. The next step describes the same model with predicted probabilities.
4.4 Predicted Probabilities for Two People
Odds ratios are hard to picture for many readers, so the model is often also described with predicted probabilities, as Section 3 does for the multinomial model. The predict() function, with type = "probs", gives the probability of each category for a chosen person. Worked Example 4.2b shows them for two 30-year-olds who differ only in smoking status; notice how the description compares the two people category by category rather than restating the odds ratio.
Worked Example 4.2b: Predicted Probabilities for Two People
The table gives the predicted probability of each category of self-rated health for a non-smoker and a smoker aged 30, from the ordinal model.
| Person | Poor | Fair | Good | Very good | Excellent |
|---|---|---|---|---|---|
| Non-smoker, age 30 | 0.05 | 0.14 | 0.29 | 0.28 | 0.24 |
| Smoker, age 30 | 0.09 | 0.22 | 0.33 | 0.22 | 0.14 |
Each row adds to 1, because every person is in exactly one category. In plain words, the smoker is more likely than the non-smoker of the same age to rate their health as poor or fair (about 9 and 22 per cent, against 5 and 14 per cent) and less likely to rate it as very good or excellent (22 and 14 per cent, against 28 and 24 per cent). About one in seven 30-year-old smokers, but about one in four non-smokers, is predicted to rate their health as excellent. A description of this kind compares the two people category by category, with the probabilities written as percentages. In R, the table comes from predict(ord, newdata = data.frame(age = 30, smoker = c("No", "Yes")), type = "probs").
Worked Example 4.2b shows the predicted probabilities and the odds ratio telling the same story in different forms. Both rest on the assumptions of the model, which the next step sets out.
4.5 Checking the Proportional-Odds Assumption
The ordinal model shares the general assumptions of logistic regression and adds one of its own. Table 4.5 lists each assumption with the way it is checked.
Table 4.5. The assumptions of ordinal logistic regression and how each is checked.
| Assumption | What it means | How to check it |
|---|---|---|
| Ordered outcome | The categories have a genuine, meaningful order. | Reasoning about the categories; the levels are set in order with factor(…, ordered = TRUE). |
| Independence | Each person contributes one independent observation. | Judged from the study design. |
| Enough people in each category | No category is nearly empty, overall or within the groups of a categorical predictor. | table(outcome) and table(predictor, outcome). |
| No strong multicollinearity | The predictors are not so strongly related that their effects cannot be separated. | Correlations among the predictors. |
| Proportional odds | Each predictor has the same odds ratio at every split of the outcome. | brant(model) from the brant package (Brant, 1990). |
The proportional-odds assumption in the last row of Table 4.5 is the one that the ordinal model adds. In plain words, it says that a predictor changes the odds of being higher up the scale by the same factor wherever the line between “at or above” and “below” is drawn. It is checked with the Brant test, whose null hypothesis is that the assumption holds, so a p-value above 0.05 is consistent with the assumption and a p-value below 0.05 is the warning sign. Expand the two panels below to see how the Brant test works and what can be done if the assumption fails.
The Brant test fits a separate binary logistic regression at each split and compares the coefficients across the splits. If the proportional-odds assumption holds, the coefficients should be similar apart from chance variation. The test reports an omnibus result for all predictors together and one result for each predictor. Each result is a chi-squared statistic with a p-value. A p-value above 0.05 means that the data are consistent with the assumption, and a p-value below 0.05 means that the predictor's odds ratio appears to change from one split to another.
There are three common responses. When a failure is driven by a category with very few people, combining it with a neighbouring category (for example, poor with fair) can solve the problem, provided the combined category still makes sense. When the assumption fails badly, the order can be set aside and a multinomial logistic regression fitted (Section 3), which gives each category its own relative risk ratios. When only one or two predictors fail, a partial proportional-odds model lets those predictors have a different odds ratio at each split while keeping one odds ratio for the others. Partial proportional-odds models are fitted with the vglm() function in the VGAM package and are beyond the scope of this course. In very large samples the Brant test can flag small differences that have no practical importance, so the split-specific odds ratios are worth inspecting before the model is abandoned.
For the PHAA model, the Brant test in Activity 4.2 gives an omnibus p-value of 0.35, so the data are consistent with one odds ratio for each predictor at every split. The card below links to a narrated walkthrough of ordinal logistic regression in R. Activity 4.2 then fits the model of this section to the PHAA data, reads its odds ratios, runs the Brant test and asks you for the predicted probabilities of two people: run the script alongside the reading and answer the questions from your own output.
Narrated R walkthrough: Ordinal Logistic Regression in R
This walkthrough fits an ordinal logistic regression to the course outcomes data. It orders the outcome categories, looks at the data before modelling, converts the results to odds ratios and predicted probabilities, and checks the proportional odds assumption.
Open the Ordinal Logistic Regression in R walkthroughText version of the activity: the code of the run-along script, its console output and notes on reading it.
library(MASS)    # polr() fits the ordinal logistic model
library(brant)   # brant() checks it; if missing, run install.packages("brant") once
phaa <- read.csv("https://heal-learn.ca/r-activities/data/phaa_outcomes.csv")   # course data, read from the website
phaa <- na.omit(phaa)                   # keep the 795 people with no missing values
phaa$smoker <- factor(phaa$smoker, levels = c("No", "Yes"))   # "No" = reference
phaa$self_rated_health <- factor(phaa$self_rated_health,
  levels = c("Poor", "Fair", "Good", "Very good", "Excellent"), ordered = TRUE)
table(phaa$smoker, phaa$self_rated_health) # people in each category, by smokingThe factor() line sets the order of the categories from Poor to Excellent and marks the variable as ordered, which polr() needs, so a higher category means better reported health. The table is the first check: every category has people in it in both smoking groups, and the smallest cell (10 smokers who rate their health as excellent) is small but not empty. If library(brant) reports that there is no package called brant, run install.packages("brant") once.
ord <- polr(self_rated_health ~ age + smoker, data = phaa, Hess = TRUE)
summary(ord)Reading the output. The Coefficients block holds one value per predictor on the log-odds scale. Both are negative, which with polr() means that older people and smokers are more likely to be in the lower (poorer) categories. The Intercepts block holds the four cut-points between neighbouring categories, which are not usually interpreted. The model reports t values but no p-values, so the confidence intervals in the next step are used to judge significance.
exp(cbind(OR = coef(ord), confint(ord)))   # odds ratios with 95% CIs
exp(10 * coef(ord)["age"])                 # odds ratio for ten years of age
exp(10 * confint(ord)["age", ]) # and its 95% CIExponentiating gives odds ratios for being in a higher category, and the model applies each one at every split of the scale. The odds ratio for smoking is 0.50 (95% CI 0.36 to 0.70). The odds ratio for age is 0.966 per year (95% CI 0.957 to 0.975), or 0.71 (95% CI 0.65 to 0.78) for ten years of age. Both intervals exclude 1.
brant(ord)                                 # H0: the assumption holds
# odds ratios from a separate logistic regression at each split ("k or better")
split_or <- sapply(c("Fair", "Good", "Very good", "Excellent"), function(k)
  coef(glm(self_rated_health >= k ~ age + smoker, data = phaa, family = binomial))[-1])
round(exp(split_or), 3)The Brant test reports an omnibus p-value of 0.35 and p-values of 0.23 for age and 0.53 for smoking. Its null hypothesis, printed on the last line, is that the proportional-odds (parallel regression) assumption holds, so p-values above 0.05 mean that the data are consistent with it. The odds ratios from a separate logistic regression at each of the four splits (Fair or better, Good or better, Very good or better, and Excellent) scatter around the model's single values: 0.38 to 0.57 for smoking against 0.50, and 0.960 to 0.974 for age against 0.966.
R Reflect on what you just ran
Answer each question from your own output, as on the final exam: find the number, say what it means, judge the check.
1. Interpret the odds ratio for smokerYes, with its 95% confidence interval, as the model states it, and interpret the odds ratio for ten years of age from lines 22 and 23. The output gives no p-values: how can you tell whether an odds ratio is statistically significant, and which of the two are?
2. In plain words, what is the proportional-odds assumption, and is it met here? Use the output of brant(ord) and the odds ratios at each split. What would you do next if the p-value for smoking had been 0.01?
3. Run your own code: at the end of the script, type two <- data.frame(age = 30, smoker = c("No", "Yes")) and round(predict(ord, newdata = two, type = "probs"), 2) and rowSums(predict(ord, newdata = two, type = "probs")) and run them. The two rows are the predicted probabilities of each category for a 30-year-old non-smoker and a 30-year-old smoker, and the last line adds up each row. Use it to check that each row is a complete distribution, and describe in plain words how the two people differ.
Your output from Activity 4.2 reproduces the odds ratio of 0.50 for smoking, the Brant test results and the predicted probabilities in Worked Example 4.2b. The key takeaways below draw the section together before its knowledge check.
Key Takeaways
- 4.1 An ordinal outcome, such as self-rated health from poor to excellent, has categories that can be ranked, but the distances between them are unknown. The two common shortcuts both lose something. Coding the categories as 1 to 5 and fitting
lm()treats every step as worth exactly one unit, assumes normal residuals that a five-category outcome cannot have, and reports slopes in "points" that are not real units. Collapsing the categories into two groups for a binary logistic regression throws away the detail within each group, and a different cut-off could give a different answer. When a question proposes either shortcut, say what it assumes or loses and recommend ordinal logistic regression, which keeps every category and uses their order. - 4.2 The ordinal model splits the outcome into "at or above" versus "below" at every possible place, so five ordered categories give four splits (Figure 4.4). Each split is a yes-or-no comparison that a binary logistic regression could handle on its own, and the ordinal model fits all of them at once. Every split gets its own intercept, because the share of people at or above it changes from one split to the next, but each predictor gets a single coefficient that is shared by all the splits. Worked Example 4.2 sets the crude odds ratios for smoking that R gives at the four splits (0.53, 0.49, 0.58 and 0.39) beside the model's single value of 0.50, and the split-specific odds ratios printed in Activity 4.2 show the same pattern once age is included.
- 4.3 You fit the ordinal model with
polr()from the MASS package, after setting the levels in order withfactor(…, ordered = TRUE), and turn its coefficients into odds ratios withexp(cbind(OR = coef(ord), confint(ord))). Each odds ratio is for being in a higher category, and it applies at every split: smokers have about half the odds of non-smokers of the same age of reporting a higher category of self-rated health (OR 0.50, 95% CI 0.36 to 0.70). Becausepolr()takes "higher" from the order of the levels, check that order before you decide whether an odds ratio below 1 means better or poorer health (see the callout How R Writes the Ordinal Model). The output gives t values but no p-values, so judge significance from the confidence interval: an interval that excludes 1 shows a statistically significant association at the 5% level. The four intercepts, such asPoor|Fair, are cut-points that are not usually interpreted, and for age a ten-year odds ratio is easier to describe: R gives it withexp(10 * coef(ord)["age"])as 0.71, or about 29% lower odds per decade. - 4.4 Odds ratios are hard for many readers to picture, so the model is often also described with predicted probabilities, which
predict()withtype = "probs"gives for every category for a person you describe innewdata. Each person's probabilities add to 1, because everyone is in exactly one category. To describe two people, compare them category by category in plain words, with the probabilities written as percentages: a 30-year-old smoker is more likely than a 30-year-old non-smoker to rate their health as poor or fair (9% and 22%, against 5% and 14%) and less likely to rate it as very good or excellent (22% and 14%, against 28% and 24%). In an answer, name the two people, say which way the probabilities shift and quote a few of the numbers, rather than restating the odds ratio. - 4.5 The proportional-odds assumption says that each predictor has the same odds ratio at every split of the outcome; in plain words, a predictor changes the odds of being higher up the scale by the same factor wherever you draw the line. The Brant test,
brant(model)from the brant package, checks it by comparing separate logistic regressions fitted at each split, and it reports an omnibus result and one result for each predictor. Its null hypothesis is that the assumption holds, so a p-value above 0.05 means the data are consistent with it (as in the PHAA model, with an omnibus p-value of 0.35), while a p-value below 0.05 means that the predictor's odds ratio appears to change across the splits. If a predictor fails, inspect its split-specific odds ratios first, especially in a very large sample, and then consider combining a sparse category with a neighbouring one, fitting a multinomial model or fitting a partial proportional-odds model. A common trap is to read a small Brant p-value as good news: here, a small p-value means the assumption is in doubt.
1. A community survey asked 1,050 adults to rate their mental health as Poor, Fair, Good, Very good or Excellent. One colleague proposes coding the answers 1 to 5 and fitting a linear regression; another proposes grouping them into "Good or better" and "Fair or poor" and fitting a logistic regression. Which response is correct?
2. The mental health outcome in Question 1 has five ordered categories. How does an ordinal logistic regression compare them?
3. The survey team fitted polr(mh ~ lonely + exercise + age10, Hess = TRUE), where mh is ordered from Poor to Excellent, lonely is 1 for adults who often feel lonely, exercise is the number of days a week with at least 30 minutes of exercise (0 to 7) and age10 is age in decades. The output gives no p-values. Which statement is correct?
polr() uses (an odds ratio above 1 favours higher categories and one below 1 favours lower categories), the odds ratios and their 95% CIs. An odds ratio of 0.42 means 0.42 times the odds, or 58% lower odds, of rating mental health in a higher category, for example Good or better rather than Poor or Fair, and the same at the other splits. A 95% CI that excludes 1 shows significance at the 5% level: 0.33 to 0.54 and 1.06 to 1.18 exclude 1, while 0.88 to 1.05 includes it. The tempting first option reverses the direction: with polr(), an odds ratio below 1 means that lonely adults are more likely, not less likely, to be in the poorer categories such as Poor. (Section 2, 4.3 Interpreting the Odds Ratios and the callout How R Writes the Ordinal Model; Objective 4.3)4. From the model in Question 3, the predicted probabilities below are for two 40-year-olds who exercise three days a week, one who does not often feel lonely and one who does. Which description is correct?
| Person | Poor | Fair | Good | Very good | Excellent |
|---|---|---|---|---|---|
| Not often lonely | 0.069 | 0.200 | 0.377 | 0.245 | 0.109 |
| Often lonely | 0.150 | 0.317 | 0.346 | 0.138 | 0.049 |
5. A Brant test for the model in Question 3 gave the results below. Separate logistic regressions at the four splits gave odds ratios for lonely of 0.70 (Fair or better against Poor), 0.52, 0.38 and 0.29 (Excellent against the rest). Is the proportional-odds assumption met, and what should be done next?
6. An occupational health survey asked 1,150 warehouse workers how much back pain had limited their work in the past month. The outcome limit was stored as an ordered factor from Not at all (263 workers) through A little (387) and Moderately (312) to A lot (188), so a higher category means more limitation. The predictors are lifting (1 = lifts loads over 20 kg on most shifts), age_dec (age in decades) and female (1 = woman). Separate logistic regressions at the three splits gave odds ratios for age_dec of 1.04 (A little or more against Not at all), 1.19 and 1.56 (A lot against the rest). Which summary of the output is correct?
polr(), an odds ratio above 1 makes the higher categories more likely, so 1.92 means higher odds of a more limiting category at every split, and its interval excludes 1. The Brant null hypothesis is that the assumption holds: lifting (0.47) and female (0.74) are consistent with it, while age and the omnibus test, both printed as 0, are below 0.05, and the split-specific odds ratios for age rise steadily from 1.04 to 1.56. Combining categories helps when a nearly empty category drives the failure, but the smallest category here has 188 workers, and a linear regression on the codes would treat every step as equal. (Section 2, 4.3 Interpreting the Odds Ratios and the callout How R Writes the Ordinal Model, and 4.5 Checking the Proportional-Odds Assumption with the accordion panels "How the Brant test works" and "What to do if the assumption fails"; Objectives 4.3 and 4.5)Multinomial Logistic Regression
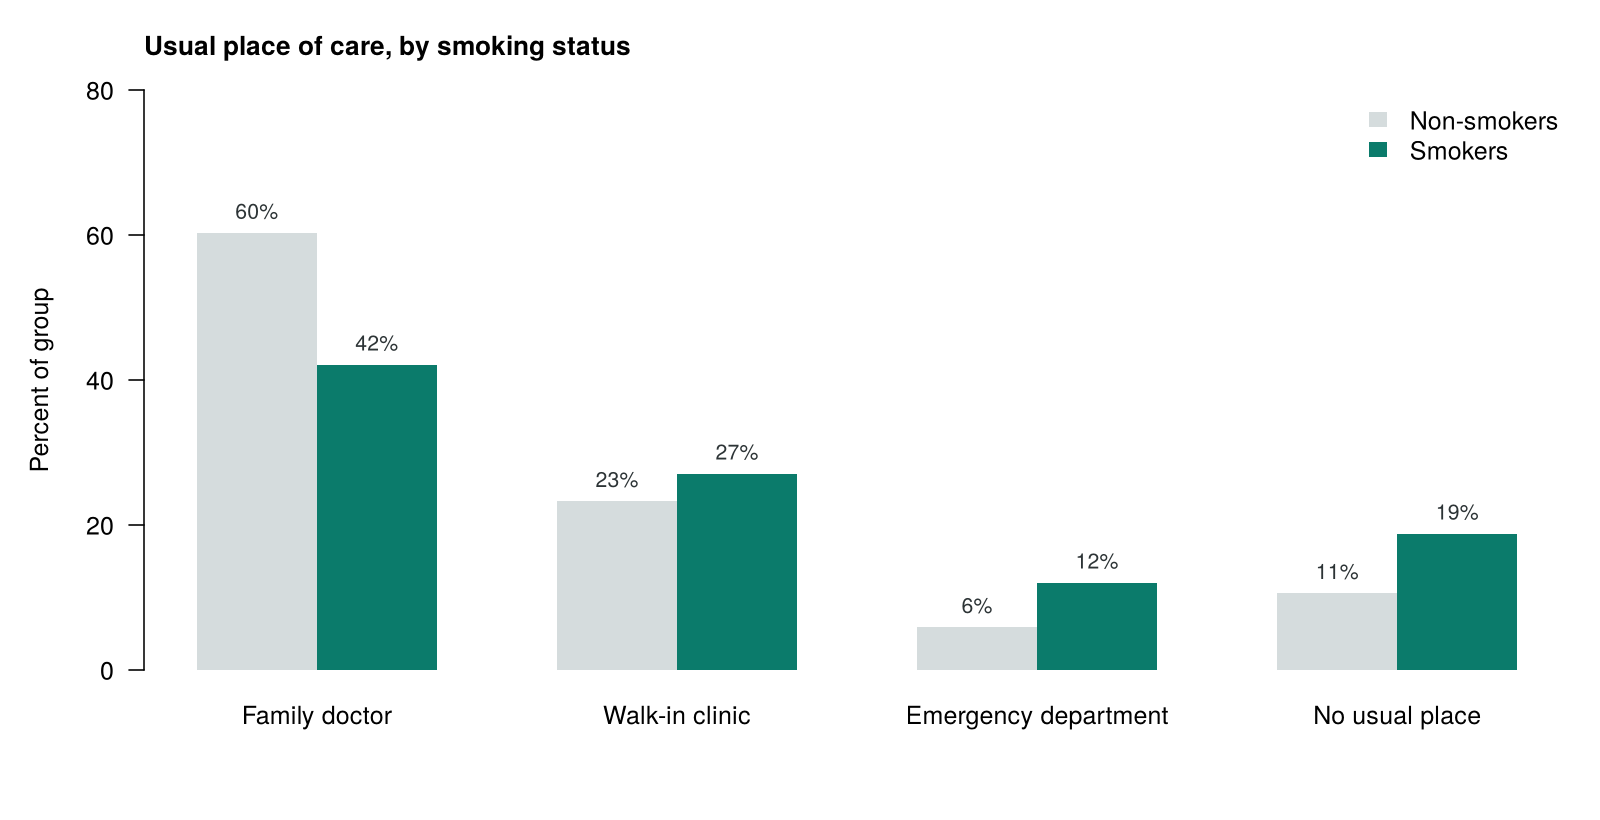
Usual place of care by smoking
Overview
This section presents multinomial logistic regression, the model for an outcome with three or more categories that have no natural order. The running example is the usual place of care, a question asked in many Canadian health surveys because having a regular source of primary care is linked to better access to preventive services and continuity of care. In the PHAA data, usual place of care is a simulated variable added for this lesson, with four categories: family doctor, walk-in clinic, emergency department and no usual place. The section explains why such an outcome needs a model of its own, shows how the model compares each category with a reference category, fits it with age and smoking as predictors, interprets its relative risk ratios and predicted probabilities, and sets out the assumptions to check.
Learning Objectives
- 5.1 Recognize a nominal outcome and explain why the ordinal model does not suit it.
- 5.2 Explain the role of the reference category, why a K-category outcome gives K − 1 comparisons, and what changes when a different reference category is chosen.
- 5.3 Fit a multinomial logistic regression in R with
multinom()and interpret its relative risk ratios with their confidence intervals, naming both categories in each comparison. - 5.4 Use predicted probabilities from the model to describe the overall chance of each category.
- 5.5 List the assumptions of the multinomial model and explain why two categories that are close substitutes make the independence of irrelevant alternatives doubtful.
5.1 What Makes an Outcome Nominal?
An outcome is nominal when its categories are simply different from one another, with no ranking. A family doctor, a walk-in clinic and an emergency department are different kinds of places, and none of them is "more" than the others. Type of cancer, main mode of travel to work, type of nicotine product and reason for missing a vaccination are other examples. Because there is no order to use, a model for a nominal outcome must let each category have its own relationship with every predictor.
A smoker might be more likely than a non-smoker to use an emergency department and also more likely to have no usual place, and the two increases need not be the same size. An ordinal model, which gives each predictor a single odds ratio for "moving up the scale", cannot describe this pattern, because there is no scale to move along.
The order of the categories therefore decides between the two models for categorical outcomes. When the categories of an outcome have no order, multinomial logistic regression is the appropriate choice. When the categories are ordered, ordinal logistic regression (Section 2) is the place to start, because it uses the order and summarizes each predictor with a single odds ratio. If the proportional-odds assumption fails, a multinomial model is a reasonable alternative, because it makes no assumption about order. The trade-off is that the multinomial model estimates many more coefficients and its results take longer to describe.
The next step shows how the multinomial model gives each category its own coefficients by comparing it with a reference category.
5.2 Comparisons With a Reference Category
The multinomial model chooses one category as the reference category and compares every other category with it. In R, the reference is set with relevel(), and this lesson uses family doctor, the most common answer. Figure 4.6 sets out the comparisons that follow from this choice. With four categories, the model makes three comparisons:
Figure 4.6. The three comparisons that the multinomial model makes for usual place of care, each with family doctor as the reference category.
In general, an outcome with K categories gives K − 1 comparisons, because the reference category is not compared with itself. Each comparison is written like a small logistic regression, with its own intercept and its own slope for every predictor (Hosmer, Lemeshow & Sturdivant, 2013). This is the key difference from the ordinal model in Section 2, where each predictor had one coefficient shared by every split. Here smoking has three separate coefficients, one for each comparison, so its association with walk-in clinic use can differ in size from its association with emergency department use. Although the comparisons look like separate logistic regressions, the model fits all of them at the same time. Fitting them together ensures that, for any person, the predicted probabilities of the four categories always add to 1, which separate models could not guarantee.
Equation 4.4 writes the model for each comparison with the reference category, with age and smoking as predictors.
The choice of reference category changes how the results are presented, but it does not change the model itself. How well the model fits and the predicted probability of each category for each person stay exactly the same whichever category is chosen, because the same information is simply being described from a different starting point. A different reference (for example, walk-in clinic) would give a different set of comparisons from the same fitted model. A good reference category is a large group that is a natural point of comparison for the research question.
Each comparison has its own coefficients, and the next step shows how their exponentiated values are read.
5.3 Interpreting Relative Risk Ratios
The exponentiated coefficients of a multinomial model are called relative risk ratios (RRRs). The name can mislead, so it helps to build the idea in two steps. First, within any one group of people, the model looks at the chance of naming a particular category relative to the chance of naming the reference category. For non-smokers, for example, this is the probability of naming an emergency department divided by the probability of naming a family doctor, written P(emergency department) ÷ P(family doctor). Second, the RRR compares that ratio between two groups. The RRR for smoking in the emergency department comparison therefore says how many times larger the ratio P(emergency department) ÷ P(family doctor) is for smokers than for non-smokers of the same age. Because each RRR describes only one comparison with the reference, a model with three comparisons has three RRRs for every predictor. An RRR above 1 means that the predictor is associated with a higher chance of the category relative to the reference, and an RRR below 1 means that it is associated with a lower chance of the category relative to the reference. An RRR of 1 means that the predictor makes no difference to that comparison.
Worked Example 4.3 applies this reading to the crude RRRs for smoking that R gives from the PHAA data and compares them with the RRRs from the model; watch how each number is read as a comparison with family doctor.
Worked Example 4.3: Crude and Adjusted Relative Risk Ratios
A multinomial model with smoking as its only predictor gives the crude RRRs, which exp(coef(mn0)) prints.
R reports the crude RRR for smoking in the Emergency department row as 2.92. It is read as a ratio of two ratios: the ratio of naming an emergency department to naming a family doctor is 2.92 times as large among smokers as among non-smokers. The (Intercept) column gives that ratio for the reference group, non-smokers, so its value of 0.10 means that about one non-smoker names an emergency department for every ten who name a family doctor. The cross-table at the start of Activity 4.3 shows where the pattern comes from: relative to the number who have a family doctor, more smokers than non-smokers name an emergency department (16 smokers against 56 with a family doctor, compared with 39 non-smokers against 399). R turns these counts into the RRR, and it is the RRR that is interpreted.
The model with age and smoking gives an RRR of 3.01 for this comparison (Table 4.6). It differs slightly from the crude value because the model also adjusts for age. The crude RRRs of 2.54 for no usual place and 1.67 for a walk-in clinic are read in the same way, each comparing the ratio of that category to family doctor among smokers with the same ratio among non-smokers.
Worked Example 4.3 shows that every RRR belongs to one comparison with the reference category. Table 4.6 gives the RRRs from the fitted model for smoking and for age in each of the three comparisons.
Table 4.6. Relative risk ratios for usual place of care from the multinomial model, with family doctor as the reference category.
| Comparison (versus Family doctor) | RRR for smokers (95% CI) | RRR per year of age (95% CI) | RRR per 10 years of age |
|---|---|---|---|
| Walk-in clinic | 1.72 (1.08 to 2.74) | 0.977 (0.96 to 0.99) | 0.79 |
| Emergency department | 3.01 (1.57 to 5.75) | 0.983 (0.96 to 1.00) | 0.84 |
| No usual place | 2.66 (1.54 to 4.61) | 0.960 (0.94 to 0.98) | 0.66 |
Smoking is associated with all three comparisons: among people of the same age, smokers are more likely than non-smokers to name a walk-in clinic, an emergency department or no usual place, each compared with a family doctor. Age is clearly associated with two of the comparisons. Older people are less likely to use a walk-in clinic (RRR 0.79 per ten years) or to have no usual place (RRR 0.66 per ten years), each compared with having a family doctor. The interval for the emergency department comparison includes 1, so the data do not show a clear age difference for that comparison. R gives the ten-year values from the unrounded coefficients with exp(10 * coef(mn)[, "age"]) (Activity 4.3).
Because each RRR compares a category only with the reference, it is easy to misread it as the overall chance of a category, a common trap that the caution below sets out.
An RRR Is a Ratio of Two Ratios
An RRR compares one category with the reference only. The RRR of 3.01 describes the ratio of emergency department to family doctor, which is three times as large for smokers as for non-smokers of the same age. It does not mean that smokers are three times as likely to name an emergency department. The overall chance that a smoker names an emergency department is a different quantity, and the predicted probabilities in Table 4.7 show it.
The next step turns to these predicted probabilities.
5.4 Predicted Probabilities
The predict() function converts the fitted model into the probability of each category for any chosen combination of predictor values. Predicted probabilities are often the clearest way to present a multinomial model to readers who are not statisticians. Table 4.7 shows them for two 30-year-olds who differ only in smoking status.
Table 4.7. Predicted probabilities of each usual place of care for a non-smoker and a smoker aged 30.
| Person | Family doctor | Walk-in clinic | Emergency department | No usual place |
|---|---|---|---|---|
| Non-smoker, age 30 | 0.51 | 0.28 | 0.06 | 0.15 |
| Smoker, age 30 | 0.32 | 0.30 | 0.12 | 0.26 |
For the 30-year-old smoker, the probability of naming an emergency department (0.12) is twice that for the non-smoker (0.06), and the probability of having no usual place rises from 0.15 to 0.26. These numbers can be stated directly in a report: in this population, about one in four 30-year-old smokers has no usual place of care.
Figure 4.7 shows the observed percentages in each category by smoking status, for all ages combined, which can be set beside the predicted probabilities in Table 4.7.
The relative risk ratios and predicted probabilities can be trusted only if the assumptions of the model hold, and the next step sets them out.
5.5 Assumptions and the Independence of Irrelevant Alternatives
Table 4.8 lists the assumptions of the multinomial model with the way each is checked. The first four resemble the assumptions of the ordinal model in Table 4.5 in Section 2, and the last, the independence of irrelevant alternatives (IIA), is new.
Table 4.8. The assumptions of multinomial logistic regression and how each is checked.
| Assumption | What it means | How to check it |
|---|---|---|
| Nominal, mutually exclusive categories | The categories have no meaningful order, and each person belongs to exactly one. | Reasoning about the categories and the survey question. |
| Independence | Each person contributes one independent observation. | Judged from the study design. |
| Enough people in every category | Each comparison is estimated separately, so a small category gives unstable estimates and wide intervals. | table(outcome) and table(outcome, predictor). Very small categories can sometimes be combined with a similar category. |
| No strong multicollinearity | The predictors are not so strongly related that their effects cannot be separated. | Correlations among the predictors. |
| Independence of irrelevant alternatives (IIA) | The comparison between any two categories does not depend on which other categories are available. | Reasoning about whether any two categories are close substitutes. Formal tests exist but are beyond the scope of this course. |
The last assumption in Table 4.8 is judged by reasoning rather than by a test in this course: it asks whether any two categories are close substitutes for each other. Expand the first panel below for an example of the independence of irrelevant alternatives and how to judge it, and the second for why the multinomial model needs more data than the ordinal model.
The IIA assumption says that the odds of choosing one category over another stay the same whether or not other categories are on offer. A classic illustration involves travel to work. Suppose people choose between a car and a red bus, with even odds. If a blue bus that is identical to the red bus is added, common sense says that the new bus takes riders mainly from the red bus, while the multinomial model assumes that it takes riders evenly from both the car and the red bus. The assumption fails because the two buses are near-perfect substitutes. In the PHAA example, a family doctor, a walk-in clinic, an emergency department and no usual place are distinct kinds of care, so the assumption is reasonable. It would be less reasonable if the categories included two very similar options, such as two walk-in clinics run by the same provider.
The same reasoning can be applied to any outcome by imagining that one category disappeared. If the walk-in clinics in a city closed, the multinomial model assumes that their former users would spread across a family doctor, an emergency department and no usual place in proportion to the existing odds. If most of them would in fact go to the emergency department, because both give care without an appointment, then the walk-in clinic and the emergency department are partly substitutes, and the assumption is doubtful. Judging the assumption therefore means asking, in plain words, whether any two categories are close substitutes for each other.
The multinomial model estimates a separate set of coefficients for every comparison. In this example, two predictors and three comparisons give six slopes and three intercepts, nine numbers in all (R reports # weights: 16 (9 variable) when trace = TRUE). An ordinal model for an outcome with the same number of categories would estimate two slopes and three cut-points. Each extra number is estimated with less information, so small categories produce wide confidence intervals. The emergency department category, with 55 people, has the widest intervals in this example.
For usual place of care, the categories are distinct kinds of care, although a walk-in clinic and an emergency department may be partly substitutes. The card below links to a narrated walkthrough of multinomial logistic regression in R. Activity 4.3 then fits the model of this section to the PHAA data, reproduces the RRRs in Table 4.6 and the predicted probabilities in Table 4.7, and changes the reference category: run the script alongside the reading and answer the questions from your own output.
Narrated R walkthrough: Multinomial Logistic Regression in R
This walkthrough fits a multinomial logistic regression to the course outcomes data. It chooses a reference category, converts the results to relative risk ratios and calculates predicted probabilities for each category.
Open the Multinomial Logistic Regression in R walkthroughText version of the activity: the code of the run-along script, its console output and notes on reading it.
library(nnet)                           # multinom() fits the multinomial model
phaa <- read.csv("https://heal-learn.ca/r-activities/data/phaa_outcomes.csv")   # course data, read from the website
phaa <- na.omit(phaa)                   # keep the 795 people with no missing values
phaa$smoker <- factor(phaa$smoker, levels = c("No", "Yes"))   # "No" = reference
phaa$usual_care <- relevel(factor(phaa$usual_care), ref = "Family doctor")   # reference category
table(phaa$usual_care, phaa$smoker) # enough people in every category?The relevel() line makes Family doctor the reference category, so it is listed first and every other category is compared with it; the other categories follow in alphabetical order. The cross-table is the first check: each comparison is estimated separately, so every category needs enough people. Every cell has people in it, and the smallest (16 smokers who name an emergency department) is small but workable. A model with smoking as its only predictor gives a crude RRR of 2.92 for smoking in the emergency department comparison (Worked Example 4.3).
mn <- multinom(usual_care ~ age + smoker, data = phaa, trace = FALSE)
summary(mn)Reading the output. The Coefficients block has one row for each comparison with the reference: the Emergency department row is Emergency department versus Family doctor, and so on. Four categories give K − 1 = 3 comparisons, each with its own intercept and its own slopes for age and smoking (nine numbers in all), on the log scale. The Std. Errors block gives a standard error for each coefficient; they are largest for the emergency department, the smallest category. Setting trace = FALSE hides the messages that multinom() otherwise prints while it fits the model.
round(exp(coef(mn)), 2)                 # relative risk ratios
round(exp(confint(mn)), 2)              # 95% CIs, one block per comparison
round(exp(10 * coef(mn)[, "age"]), 2) # RRRs for ten years of ageThe first table holds the relative risk ratios, and the three blocks that follow hold their 95% confidence intervals, one block per comparison. For smoking, the RRRs are 3.01 for an emergency department (1.57 to 5.75), 2.66 for no usual place (1.54 to 4.61) and 1.72 for a walk-in clinic (1.08 to 2.74), each compared with a family doctor. Each RRR is a ratio of two ratios: for example, the ratio of emergency department to family doctor is about three times as high for smokers as for non-smokers of the same age. The last line gives the RRRs for ten years of age (0.84, 0.66 and 0.79). R works them out from the unrounded coefficients, so read the ten-year values from this line rather than from the rounded per-year RRRs in the first table.
new_people <- data.frame(age = 30, smoker = c("No", "Yes"))   # a non-smoker and a smoker
round(predict(mn, newdata = new_people, type = "probs"), 2)Row 1 is a 30-year-old non-smoker and row 2 is a 30-year-old smoker. Each row adds to 1 (apart from rounding), because the predicted probabilities give the overall chance of each category. The smoker's probability of having a family doctor is 0.32, compared with 0.51 for the non-smoker, and the probability of naming an emergency department is 0.12, compared with 0.06.
R Reflect on what you just ran
Answer each question from your own output, as on the final exam: find the number, say what it means, and name both categories in every comparison.
1. How many comparisons does the model make, and what does each one compare? Interpret the relative risk ratio (RRR) for smokerYes in the No usual place row, with its 95% confidence interval, naming both categories. Is age clearly associated with all three comparisons? Explain using the confidence intervals.
2. A colleague writes: “The RRR of 3.01 shows that smokers are three times as likely as non-smokers to use an emergency department.” Use the predicted probabilities for the two 30-year-olds to correct this statement. Then describe the difference between the two people in a way a health planner could use.
3. Run your own code: at the end of your script, type and run these four lines, which make Walk-in clinic the reference category and fit the same model again.phaa$care2 <- relevel(phaa$usual_care, ref = "Walk-in clinic")mn2 <- multinom(care2 ~ age + smoker, data = phaa, trace = FALSE)round(exp(coef(mn2)), 2)AIC(mn, mn2)
What is the same in the two models, and what has changed? Then explain in plain words what the independence of irrelevant alternatives (IIA) assumes, and use walk-in clinics and emergency departments to say why it might not hold here.
mn2 now compares a category with walk-in clinic, so its RRRs answer different questions. For smoking, the Family doctor row shows 0.58, the walk-in clinic comparison of the first model (1.72) turned around, and the Emergency department row shows 1.74, the ratio of emergency department to walk-in clinic for smokers compared with non-smokers. The IIA assumption says that the odds of choosing one category over another stay the same whatever other categories are available: if walk-in clinics closed, their users would spread across the other options in proportion to the existing odds. A walk-in clinic and an emergency department may be close substitutes, because both give care without an appointment, so most walk-in users would probably move to an emergency department, and the assumption may not hold.Your output from Activity 4.3 reproduces the relative risk ratios in Table 4.6 and the predicted probabilities in Table 4.7, and the refit with walk-in clinic as the reference shows that only the reported comparisons change. The key takeaways below draw the section together before its knowledge check.
Key Takeaways
- 5.1 A nominal outcome, such as usual place of care, has categories that are simply different from one another, with no ranking: a family doctor is not "more" than a walk-in clinic. Because there is no scale to move along, each category needs its own relationship with every predictor. Smoking, for example, could raise the chance of using an emergency department and the chance of having no usual place by different amounts. The ordinal model cannot describe this, because it summarises each predictor with a single odds ratio for moving up the scale. When you choose a model, first ask whether the categories have a genuine order; if they do not, the answer is multinomial logistic regression, whatever numbers the categories happen to be stored as.
- 5.2 The multinomial model picks one category as the reference and compares every other category with it, so an outcome with K categories gives K − 1 comparisons, each with its own intercept and its own slopes. With family doctor as the reference, the four places of care give three comparisons: walk-in clinic, emergency department and no usual place, each compared with family doctor. In R, the reference is set with
relevel(), and a good choice is a large group that is a natural point of comparison for the research question. Changing the reference changes which comparisons are reported, but it does not change how well the model fits or its predicted probabilities. In any question, find the reference category first, because every number in the output is read against it. - 5.3 You fit the model with
multinom()from the nnet package and get relative risk ratios (RRRs) and their intervals fromexp(coef(mn))andexp(confint(mn)), with one row or block for each comparison. An RRR is a ratio of two ratios that belongs to one comparison only: the RRR of 3.01 for smoking in the emergency department row means that the ratio of emergency department to family doctor is about three times as large for smokers as for non-smokers of the same age. Every interpretation should therefore name both categories (for example, "emergency department compared with family doctor") as well as the groups being compared. A confidence interval that excludes 1 shows a clear association for that comparison only, so check each comparison on its own: the age interval for the emergency department comparison (0.96 to 1.00) includes 1, while the age intervals for the other two comparisons do not. For age, a ten-year RRR is easier to describe, andexp(10 * coef(mn)[, "age"])gives it from the unrounded coefficients. - 5.4 Predicted probabilities from
predict(mn, newdata = new_people, type = "probs")give the overall chance of each category for the people you choose, and each person's probabilities add to 1. They are often the clearest way to present a multinomial model, because they answer the question readers usually ask: how likely is this kind of person to be in each category? For a 30-year-old smoker, the predicted chance of naming an emergency department is 0.12, twice the 0.06 for a non-smoker of the same age, and the chance of having no usual place rises from 0.15 to 0.26. A common trap is to read an RRR as "times as likely": the RRR of 3.01 compares a ratio of two categories, whereas the overall chance of a category comes from the predicted probabilities (see the callout An RRR Is a Ratio of Two Ratios). If a claim says that one group is "three times as likely" to be in a category, check it against the predicted probabilities before you accept it. - 5.5 The multinomial model needs nominal, mutually exclusive categories (each person in exactly one), independent observations, enough people in every category and no strong multicollinearity. Check the numbers with
table(outcome, predictor): each comparison is estimated separately, so a small category gives unstable estimates and wide intervals, which is why the emergency department category has the widest intervals in this example. The model also assumes the independence of irrelevant alternatives (IIA): the odds of choosing one category over another stay the same whether or not other categories are on offer. To judge it, imagine that one category disappeared and ask where its members would go; if most of them would move to one particular category, as walk-in clinic users might move to the emergency department, those two categories are close substitutes and the assumption is doubtful. In an answer, explain IIA in plain words first and then apply it to the two categories in the question that look most alike.
1. A provincial survey asked 1,200 adults for their main source of health information: Family doctor, Pharmacist, Health websites, or Friends and family, stored in the file as 1 to 4. A colleague proposes an ordinal logistic regression, "because the codes give the categories an order and the model needs fewer coefficients". Which response is correct?
2. The analyst fitted multinom() twice to the outcome in Question 1, first with Family doctor as the reference category and then with Health websites as the reference. The two models fit the data equally well. Which statement is correct?
3. With Family doctor as the reference, the relative risk ratios (RRRs) for living in a rural area (rural = 1), adjusted for age, were as follows. Which interpretation is correct?
| Comparison (versus Family doctor) | RRR for rural adults (95% CI) |
|---|---|
| Pharmacist | 1.62 (1.15 to 2.28) |
| Health websites | 1.10 (0.84 to 1.44) |
| Friends and family | 2.40 (1.65 to 3.49) |
4. A colleague writes: "The RRR of 2.40 shows that rural adults are 2.4 times as likely as urban adults to rely on friends and family, and the RRR of 1.10 shows that they are more likely to use health websites." The predicted probabilities for two 45-year-olds are below. Which correction is right?
| Person | Family doctor | Pharmacist | Health websites | Friends and family |
|---|---|---|---|---|
| Urban, age 45 | 0.48 | 0.14 | 0.28 | 0.10 |
| Rural, age 45 | 0.38 | 0.18 | 0.25 | 0.19 |
5. Suppose the survey had split Health websites into two categories, Government health websites and Other health websites, giving five sources in all. Which statement about the independence of irrelevant alternatives (IIA) is correct?
6. A perinatal survey asked 1,400 pregnant people where they planned to give birth (place): Hospital (the reference category), Birth centre or Home. The predictors are rural (1 = lives more than 50 km from a hospital with a maternity unit) and first (1 = a first birth). The last lines of the output are the predicted probabilities for an urban and a rural resident who have given birth before. A colleague writes: "Rural residents are three times as likely as urban residents to plan a home birth, and they are also more likely to plan a birth-centre birth." Which response is correct?
rural with their intervals and the two rows of predicted probabilities. An RRR is a ratio of two ratios: 2.97 says that P(home) ÷ P(hospital) is about three times as high for rural as for urban residents with the same birth history, and its interval excludes 1. The overall chance of planning a home birth comes from the predicted probabilities, about 4 in 100 urban residents against about 11 in 100 rural residents, so the colleague's sentence should be written with these chances rather than with the RRR, and a hospital birth remains by far the most likely plan in both rows. The birth-centre RRR of 1.34 is above 1, but its interval includes 1, so it does not show a clear association, and neither RRR compares a home birth with a birth centre directly. (Section 3, 5.3 Interpreting Relative Risk Ratios and the callout An RRR Is a Ratio of Two Ratios, and 5.4 Predicted Probabilities, Table 4.7; Objectives 5.3 and 5.4)Poisson and Negative Binomial Regression Modelling
One number describes it: the mean
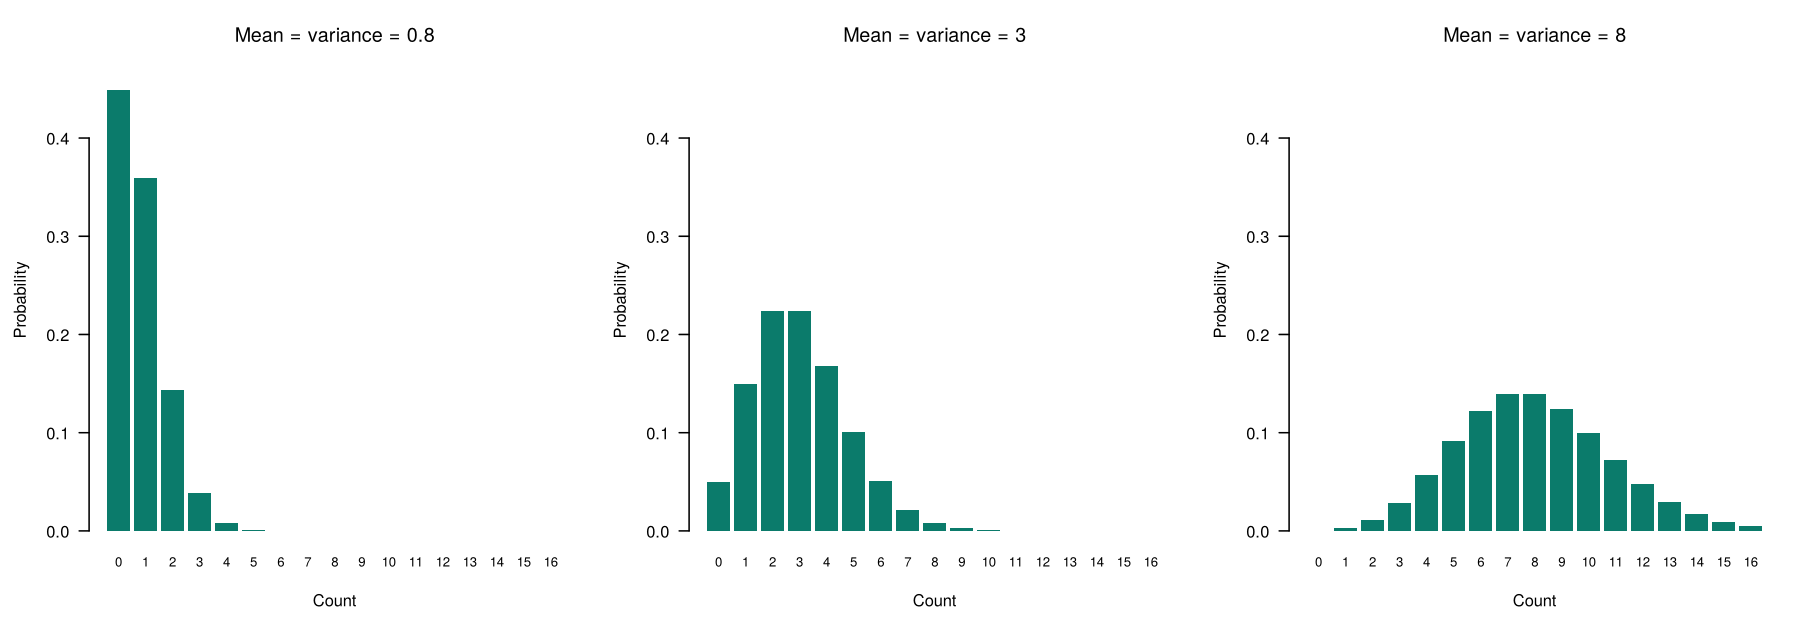
Overdispersion makes the Poisson model overconfident
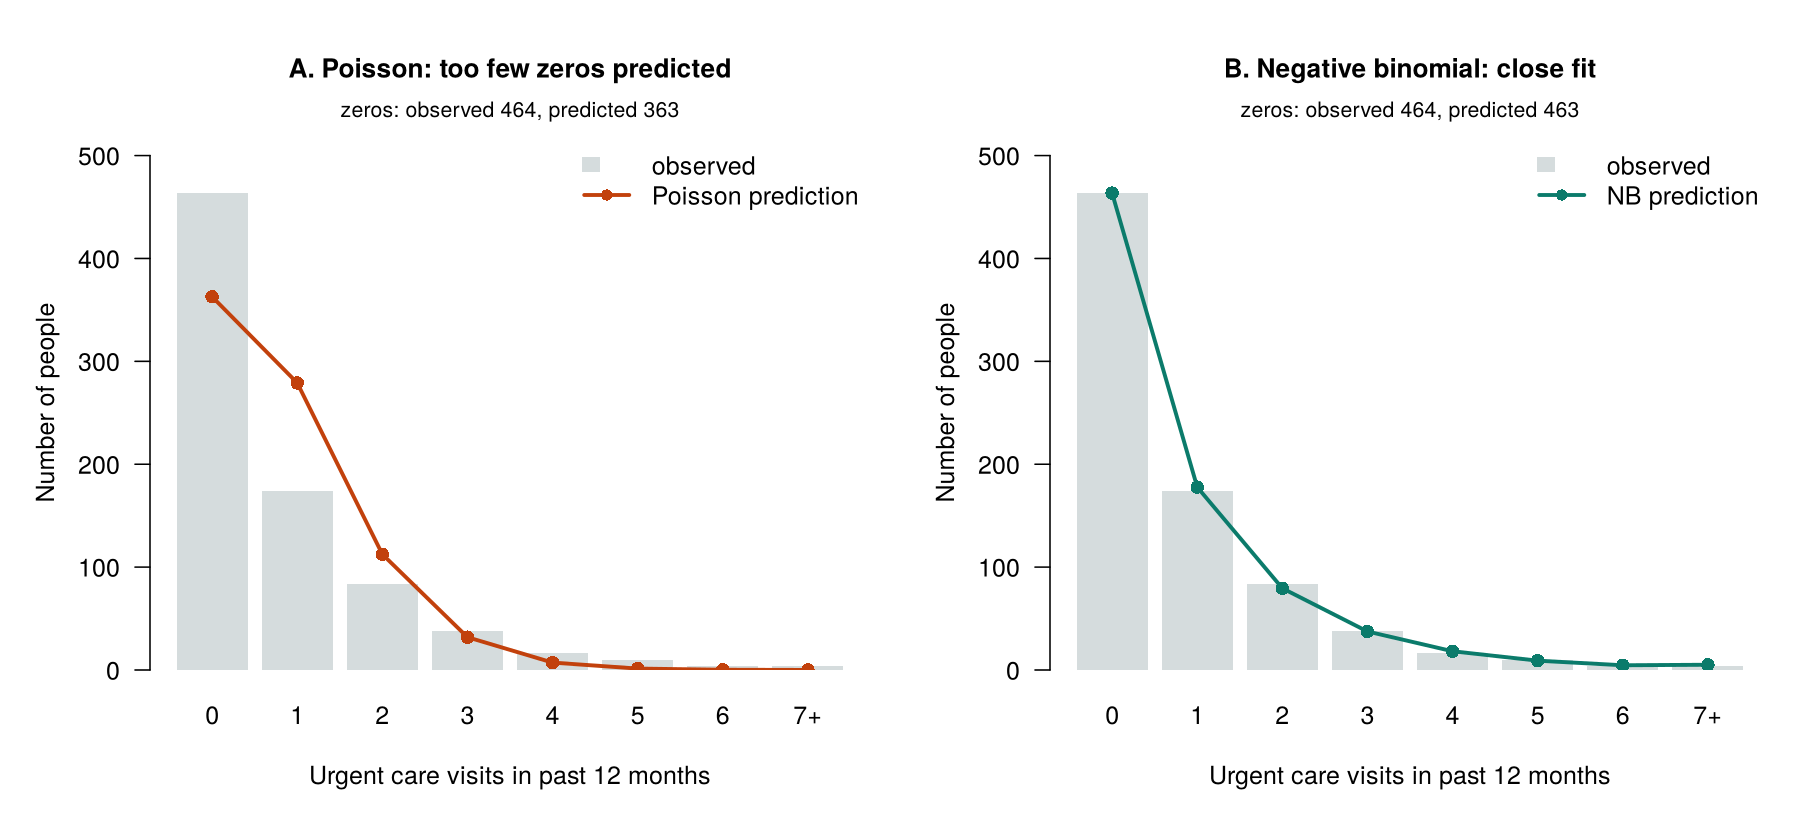
Overview
This section presents the two standard models for counts, Poisson regression and negative binomial regression. The running example is the number of urgent care visits each PHAA participant made in the past 12 months, a simulated variable added for this lesson. The section describes the features of count data and the Poisson distribution, fits a Poisson regression and interprets its incidence rate ratios, explains when an offset is needed, checks the model for overdispersion, and then fits a negative binomial regression and compares the two models.
Learning Objectives
- 6.1 Describe the features of count outcomes and the Poisson distribution, including its mean-equals-variance property.
- 6.2 Fit a Poisson regression in R and interpret its incidence rate ratios (IRRs), including an IRR given for a ten-year difference in age.
- 6.3 Explain when an offset is needed and how it turns a count model into a rate model.
- 7.1 Check a Poisson model for overdispersion with the dispersion ratio and the count of zeros, and explain what overdispersion does to its standard errors, confidence intervals and p-values.
- 7.2 Fit a negative binomial regression in R and choose between the two models with the AIC, the dispersion ratio and the expected zeros.
6.1 Count Outcomes and the Poisson Distribution
A count records how many times an event happened to a person, or in a place, over a period of time. Counts are whole numbers, they cannot be negative, and their distribution is usually skewed to the right, with many zeros and small values and a long tail of larger values. In the PHAA data, the 795 participants made between 0 and 12 urgent care visits in the past year: 464 (58%) made none, 174 made one and 84 made two, and only 4 made eight or more. The average was 0.80 visits per person.
A linear regression of these counts would break several assumptions at once. Its residuals would be skewed (not normal), their spread would grow with the predicted value (unequal variance), and the model could predict a negative number of visits. Figure 4.3 in Section 1, which showed a linear model fitted to urgent_visits, illustrates the first two problems.
Counts therefore need a distribution suited to whole numbers of zero or more, and the Poisson distribution is the one on which Poisson regression is built.
The Poisson distribution describes the number of events in a fixed period when events happen independently of one another at a constant average rate. It is named after the French mathematician Siméon-Denis Poisson. The whole distribution is defined by one number, its mean (written μ, the Greek letter mu), and its most important property is that its variance equals its mean. A Poisson count with a mean of 3 has a variance of 3, and a Poisson count with a mean of 0.8 has a variance of 0.8.
Figure 4.8 shows how the shape of the distribution changes as its mean increases.
The mean-equals-variance property is what makes the Poisson distribution simple, and it is also what most often goes wrong when it is applied to real health data. The checks for overdispersion in 7.1 are built around it.
Poisson regression, the subject of the next step, uses this distribution to model how the expected count changes with the predictors.
6.2 Poisson Regression and Incidence Rate Ratios
Poisson regression is the GLM with a Poisson distribution and a log link. The log of the expected count is set equal to the linear predictor, as Equation 4.5 shows for urgent care visits with age and smoking as predictors.
The log link changes how a predictor affects the outcome. In linear regression, a predictor adds a fixed amount to the average outcome. In Poisson regression, because the straight line is drawn on the log scale, a predictor instead multiplies the expected count by a fixed factor. That factor is the exponentiated coefficient eβ, and since it describes how many times larger one expected count is than another, it is a ratio of expected counts, called the incidence rate ratio (IRR). An IRR of 1 means no association, because the expected count is multiplied by 1 and does not change. An IRR above 1 means more events, and an IRR below 1 means fewer events. In the PHAA data, the Poisson model gives an IRR for smoking of 1.44 (95% CI 1.19 to 1.73): smokers make about 44% more urgent care visits than non-smokers of the same age. The IRR for age is 1.013 per year (95% CI 1.007 to 1.018). For ten years of age, exp(10 * coef(pois)["age"]) gives 1.13 from the unrounded coefficient (Activity 4.4), or about 13% more visits for each decade of age. Because the effects multiply, the ten-year IRR is not simply ten times the one-year percentage. Each extra year multiplies the expected count again, so the small yearly increases compound in the way that interest compounds in a savings account. For this reason the ten-year IRR is read from the line that R prints rather than worked out from the per-year value.
The same template reads every IRR. Subtract 1 from the IRR and express the result as a percentage: an IRR of 1.20 means a rate 20% higher, and an IRR of 0.85 means a rate 15% lower. Each of these describes a one-unit difference in the predictor, such as one year of age or being a smoker rather than a non-smoker, with the other predictors held constant. When an IRR is reported for a larger difference, such as ten years of age, it is read in the same way for that larger difference. Some predictors are log-transformed before they enter the model, as in a variable such as the natural log of hours + 1. For these, a one-unit difference on the log scale does not mean one more hour. It means that the original quantity is about 2.7 times as large (e1 ≈ 2.72), so the IRR compares people whose original values differ by that factor rather than by a fixed amount.
Worked Example 4.4 shows the crude rate ratio for smoking that R gives and compares it with the IRR from the model; watch what the intercept and the ratio each describe.
Worked Example 4.4: Crude and Adjusted Rate Ratios
A Poisson model with smoking as its only predictor gives the crude rate ratio, which exp(coef()) prints.
With smoking as the only predictor, the intercept, 0.745, is the average number of visits among non-smokers (n = 662), and the crude IRR of 1.45 says that the average among smokers (n = 133) is 1.45 times as high: smokers made about 45% more visits. The Poisson model’s IRR of 1.44 is almost the same, because it also adjusts for age, which is only weakly related to smoking in these data.
As Worked Example 4.4 shows, an IRR compares expected counts between groups. The next step shows how the same model is adapted when the length of follow-up differs from person to person.
6.3 Different Follow-Up Times: The Offset
Every PHAA participant reported urgent care visits over the same 12 months, so their counts can be compared directly. Many studies instead follow people for different lengths of time, or count events in places with different population sizes. A person followed for ten years has more time to accumulate visits than a person followed for one year, and a city of a million people has more cases than a town of ten thousand. Comparing raw counts in these situations would be unfair, because a higher count might reflect nothing more than a longer time or a larger population. What we want to compare is the rate, the number of events per unit of time or per person. Poisson regression handles this with an offset. The log of each unit's follow-up time (or population size) is added to the model as an extra term, but unlike a predictor its coefficient is not estimated; it is fixed at 1. Fixing the coefficient at 1 means that the expected count rises in exact proportion to the time observed, so doubling the follow-up time doubles the expected count. In effect, the offset divides each count by its follow-up time, turning the model for counts into a model for rates, such as visits per person-year. This is why the exponentiated coefficients are called incidence rate ratios (Frome, 1983).
Two consequences of the offset are worth stating plainly. First, a model with an offset describes a rate, so the expected number of events for a person is that rate multiplied by the time observed: a person followed for six months is expected to have half as many visits as an identical person followed for a year. Second, leaving the offset out can change a comparison completely. If one group is followed for much less time than another, it can have fewer events in total even though its events happen more often per year. Without the offset, the model compares the totals and the group looks like a light user of care; with the offset, it compares the rates and shows the group's true, higher rate. An offset is not needed when every person's count covers the same period, as in the urgent care example.
Activity 4.4, at the end of this section, fits a Poisson model with offset(log(fu_years)) to the PHAA follow-up file, in which the length of follow-up differs from person to person, and shows how its IRRs are then read as ratios of rates.
An offset accounts for differences in follow-up time or population size. The next step is the main check of a Poisson model, which concerns its assumption that the variance equals the mean.
7.1 Checking the Poisson Model for Overdispersion
The Poisson model assumes that the variance of the counts equals their mean, after the predictors are taken into account. When the variance is larger than the mean, the data are overdispersed. Overdispersion is common in health data, because people differ in ways the predictors do not capture: some people use health care much more than others of the same age and smoking status. Three checks reveal it.
Table 4.9 sets out the three checks, with the result of each for the PHAA data.
Table 4.9. Three checks for overdispersion in a Poisson model, with the results for urgent care visits in the PHAA data.
| Check | How R gives it | Rule of thumb | PHAA result |
|---|---|---|---|
| Mean and variance of the counts | mean(y) and var(y) | A variance much larger than the mean is a warning sign (a first look only, because it ignores the predictors). | Mean 0.80, variance 1.76 |
| Dispersion ratio | sum(residuals(model, type = "pearson")^2) / df.residual(model): the sum of squared Pearson residuals ÷ the residual degrees of freedom | Close to 1 supports the Poisson model; clearly above 1 (for example, above about 1.5) signals overdispersion. | 2.05 |
| Observed and expected zeros | sum(y == 0) and sum(dpois(0, fitted(model))) | The two numbers should be similar. | 464 observed, 363 expected |
All three checks point to overdispersion. The variance of 1.76 is more than twice the mean of 0.80, the dispersion ratio of 2.05 says that the residuals vary about twice as much as the Poisson model expects, and there are about 100 more people with no visits than the model predicts. The consequence is that the Poisson model is overconfident. The model calculates its standard errors from the variance it assumes, and it assumes a smaller variance than the data actually have, so it believes its estimates are more precise than they really are. As a result its standard errors are too small, its confidence intervals are too narrow and its p-values are too small. Notice that the estimates themselves, such as the IRR for smoking, are not necessarily wrong; it is the stated certainty around them that is wrong. An analysis that ignored the problem could therefore report an association as more certain than the data justify, or call an association statistically significant when it is not.
Figure 4.9 compares the observed numbers of people with each count of visits with the numbers expected by the Poisson model and by the negative binomial model introduced in 7.2.
Before the Poisson model is replaced, one source of apparent overdispersion should be ruled out, as the caution below explains.
Apparent Overdispersion
Sometimes a Poisson model looks overdispersed because the model itself is incomplete: an important predictor is missing, or an offset for follow-up time has been left out. Before switching to a negative binomial model, it is worth asking whether the model includes the predictors and the offset that the study design calls for.
In the PHAA data every count covers the same 12 months, so a missing offset does not explain the extra spread. When the model includes the predictors and offset that it needs and the checks still show overdispersion, a model that allows the variance to exceed the mean is required, and the next step introduces it.
7.2 Negative Binomial Regression and Choosing Between the Models
Negative binomial regression keeps the log link and the IRR interpretation of Poisson regression and adds one extra parameter, θ (theta), that allows the variance to exceed the mean. The variance of a negative binomial count is μ + μ²/θ. The first part of this expression, μ, is the Poisson variance, and the second part, μ²/θ, is the extra variation that the Poisson model left out. Because θ sits underneath the extra term, the two move in opposite directions. A small θ makes the extra term large, which means a lot of extra variation. As θ becomes very large, the extra term shrinks toward zero, the variance returns to μ, and the model becomes a Poisson model. The negative binomial model can therefore be thought of as a Poisson model with an adjustable allowance for extra spread, which it estimates from the data (Hilbe, 2011). In R, the model is fitted with glm.nb() from the MASS package, and the output reports θ as Theta.
For the urgent care visits, θ is 0.77. The negative binomial model gives an IRR for smoking of 1.44 (95% CI 1.08 to 1.91), almost the same point estimate as the Poisson model. The confidence interval, however, is wider (it was 1.19 to 1.73 under the Poisson model), and the p-value rises from 0.0001 to 0.012. The IRR for age is 1.012 per year (95% CI 1.004 to 1.020). The associations remain, and the negative binomial model reports them with appropriate uncertainty.
Table 4.10 sets the results of the two models side by side.
Table 4.10. Results of the Poisson and negative binomial models for urgent care visits.
| Result | Poisson | Negative binomial |
|---|---|---|
| IRR for smoking (95% CI) | 1.44 (1.19 to 1.73) | 1.44 (1.08 to 1.91) |
| p-value for smoking | 0.0001 | 0.012 |
| IRR per year of age (95% CI) | 1.013 (1.007 to 1.018) | 1.012 (1.004 to 1.020) |
| AIC (lower is better) | 2154.9 | 1954.3 |
| Dispersion ratio | 2.05 | 0.99 |
| Expected zeros (464 observed) | 363 | 463 |
The comparison favours the negative binomial model on every check. The AIC (Akaike information criterion) measures how well a model fits the data, with a penalty for each parameter it estimates. The penalty matters because a model with more parameters will almost always fit a little better simply because it is more flexible, so the AIC asks whether the better fit is large enough to justify the extra complexity. A lower value is better. Here the negative binomial model estimates one more parameter than the Poisson model (θ), and the AIC shows whether that addition earns its place. A difference of about 10 points or more is usually taken as strong support for the model with the lower AIC (Burnham & Anderson, 2004), and here the negative binomial AIC is lower by far more than that (1954.3 against 2154.9). The dispersion ratio of the negative binomial model is 0.99, and it expects 463 zeros against the 464 observed.
The negative binomial model fits these counts well, but some data have even more zeros. Expand the panel below for the models used when the counts contain many more zeros than even a negative binomial model expects.
In some data the number of zeros is much larger than even a negative binomial model expects. This often happens when part of the population cannot have the event at all, for example people who never use a particular service. Zero-inflated and hurdle models handle this situation by combining a model for "any events versus none" with a model for the number of events. They are fitted with the pscl package and are beyond the scope of this lesson. In the PHAA example, the negative binomial model already predicts the zeros well, so no further model is needed.
The two count models share most of their assumptions. Table 4.11 lists the assumptions of the Poisson and negative binomial models, whether each model requires them and how each is checked; the two models differ only in the assumption about the variance.
Table 4.11. The assumptions of the Poisson and negative binomial models and how each is checked.
| Assumption | Poisson | Negative binomial | How to check it |
|---|---|---|---|
| The outcome is a count (whole numbers of 0 or more) | Required | Required | table(outcome) or summary(outcome) |
| Independent observations | Required | Required | Judged from the study design |
| Each predictor multiplies the expected count (log link) | Required | Required | Built into the model; for a continuous predictor, a squared term can test for curvature |
| Different follow-up times are accounted for | Offset needed | Offset needed | offset(log(time)) in the formula |
| The variance equals the mean | Required | Relaxed: variance may be larger | Dispersion ratio; observed versus expected zeros; AIC comparison |
With the count models complete, the five types of outcome in this lesson can be set side by side.
Additional Context
This summary is background that draws the lesson together rather than a separate objective. The four sections of this lesson apply the same approach to five types of outcome. The type of the outcome is identified first, and it points to a model. The model is fitted with the same linear predictor (here, age and smoking), its exponentiated coefficients are read as the ratio that its link function implies, and its own assumptions are checked before the results are reported.
Table 4.12 summarises the five PHAA examples, with the model, the effect of smoking and the main check for each.
Table 4.12. The five types of outcome in the PHAA examples, with the model and R function, the effect of smoking (95% CI) and the main check for each.
| Outcome type (PHAA example) | Model and R function | Effect of smoking | Main check |
|---|---|---|---|
| Continuous (systolic blood pressure) | Linear, lm() | +6.06 mmHg (4.33 to 7.79) | Residual plots |
| Binary (hypertension) | Logistic, glm(family = binomial) | OR 2.65 (1.04 to 6.30) | Events per predictor |
| Ordinal (self-rated health) | Ordinal logistic, polr() | OR 0.50 for a higher category (0.36 to 0.70) | Brant test |
| Nominal (usual place of care) | Multinomial logistic, multinom() | RRR 3.01 for emergency department versus family doctor (1.57 to 5.75) | People per category; IIA |
| Count (urgent care visits) | Negative binomial, glm.nb() | IRR 1.44 (1.08 to 1.91) | Dispersion ratio, AIC, zeros |
The card below links to a narrated walkthrough of count models in R. Activity 4.4, after the card, fits the Poisson model for urgent care visits, adds an offset for the follow-up data, runs the overdispersion checks in Table 4.9 and fits the negative binomial model to reproduce the comparison in Table 4.10: run the script alongside the reading and answer the questions from your own output.
Narrated R walkthrough: Poisson and Negative Binomial Regression in R
This walkthrough models a count outcome. It compares the mean and the variance of the counts, fits a Poisson regression and reads its rate ratios, checks for overdispersion, fits a negative binomial regression and compares the two models.
Open the Poisson and Negative Binomial Regression in R walkthroughText version of the activity: the code of the run-along script, its console output and notes on reading it.
library(MASS)                           # glm.nb() fits the negative binomial model (part 5)
phaa <- read.csv("https://heal-learn.ca/r-activities/data/phaa_outcomes.csv")   # course data, read from the website
phaa <- na.omit(phaa)                   # keep the 795 people with no missing values
phaa$smoker <- factor(phaa$smoker, levels = c("No", "Yes"))   # "No" = reference
table(phaa$urgent_visits)    # how many people had 0, 1, 2, ... visits
mean(phaa$urgent_visits)     # the average count
var(phaa$urgent_visits) # the variance (spread) of the countsThe table shows the shape of a typical count: 464 people with no visits, 174 with one visit and a long tail up to 12 visits. The mean (0.80) and the variance (1.76) give a first warning, because a Poisson count would have a variance close to its mean. It is only a first look, because it ignores the predictors.
pois <- glm(urgent_visits ~ age + smoker, data = phaa, family = poisson)
summary(pois)
exp(cbind(IRR = coef(pois), confint(pois)))   # IRRs with 95% CIs
exp(10 * coef(pois)["age"]) # IRR for ten years of ageReading the output. The Estimate column is on the log scale, so the third line exponentiates it to give incidence rate ratios. The IRR for smoking is 1.44 (95% CI 1.19 to 1.73): smokers make about 44% more urgent care visits than non-smokers of the same age. The IRR for age is 1.013 per year (95% CI 1.007 to 1.018), and the last line gives the IRR for ten years of age from the unrounded coefficient, 1.13, or about 13% more visits for each decade of age. The line (Dispersion parameter for poisson family taken to be 1) is a reminder that the model assumes that the variance equals the mean.
fu <- read.csv("https://heal-learn.ca/r-activities/data/phaa_followup.csv")   # course data, read from the website
fu$smoker <- factor(fu$smoker, levels = c("No", "Yes"))   # GP visits over 0 to 10 years
gp <- glm(gp_visits ~ age + smoker + offset(log(fu_years)), data = fu, family = poisson)
round(exp(cbind(IRR = coef(gp), confint(gp))), 3)The PHAA follow-up file (phaa_followup.csv) records the number of GP visits each participant made during follow-up, which ranges from a few days to ten years (fu_years). Because follow-up time differs, the model needs offset(log(fu_years)). With the offset in place, the IRRs compare rates of GP visits per year of follow-up. Smokers have a GP visit rate 1.23 times that of non-smokers of the same age (95% CI 1.17 to 1.30), and the rate rises by about 1.8% for each year of age. The intercept (0.685) is the visit rate per year for a non-smoker aged 0 and is not interpreted. Without the offset, a person followed for ten years would appear to use far more care than a person followed for one year, simply because of the extra time.
sum(residuals(pois, type = "pearson")^2) / df.residual(pois)   # dispersion ratio
sum(phaa$urgent_visits == 0)                                   # zeros observed
sum(dpois(0, fitted(pois))) # zeros expectedThe dispersion ratio is 2.05, about twice the value of 1 that a Poisson model assumes. The data contain 464 people with zero visits, but the Poisson model expects only about 363. Both checks show overdispersion, so the confidence intervals from this model are too narrow and its p-values are too small.
nb <- glm.nb(urgent_visits ~ age + smoker, data = phaa)
summary(nb)
exp(cbind(IRR = coef(nb), confint(nb)))       # IRRs with 95% CIs
sum(dnbinom(0, mu = fitted(nb), size = nb$theta)) # zeros expected by NBReading the output. The coefficients look much like those of the Poisson model, but their standard errors are larger (0.145 for smoking, compared with 0.095). Theta (0.77) is the extra parameter that lets the variance exceed the mean. The IRR for smoking is 1.44 (95% CI 1.08 to 1.91), and its p-value is 0.012, compared with 0.0001 under the Poisson model. The last line shows that the negative binomial model expects about 463 zeros, against the 464 observed. Question 3 asks you to finish the comparison yourself with AIC(pois, nb) and the dispersion ratio of nb.
R Reflect on what you just ran
Answer each question from your own output, as on the final exam: find the number, say what it means, judge the check.
1. The urgent care counts all cover the same 12 months, but the GP visits in fu were counted over follow-up times from a few days to ten years. What does offset(log(fu_years)) do in the model gp, why is it needed there but not in pois, and what do the incidence rate ratios (IRRs) from gp therefore compare? Interpret the IRR for smokerYes from gp, with its 95% confidence interval.
fu were counted over follow-up times from a few days to ten years. The offset adds the log of each person’s follow-up time to the model with its coefficient fixed at 1, which turns the model for counts into a model for rates, GP visits per year of follow-up. Without it, a person followed for ten years would appear to use far more care than a person followed for one year, simply because of the extra time; with it, a person’s expected number of visits is the rate multiplied by the time observed. The IRRs therefore compare visit rates, not total visits, between people who differ by one unit of a predictor, with the other predictors held constant. The IRR for smoking is 1.23 (95% CI 1.17 to 1.30): smokers have a GP visit rate about 1.23 times (23% higher than) that of non-smokers of the same age, and the interval excludes 1.2. Is the Poisson model pois adequate? Use the dispersion ratio and the observed and expected numbers of zeros. A colleague argues that the overdispersion does not matter, because the IRR for smoking is clearly above 1. Do you agree? Explain what overdispersion does to the standard errors, confidence intervals and p-values.
3. Run your own code: at the end of the script, type AIC(pois, nb) and run it, then type sum(residuals(nb, type = "pearson")^2) / df.residual(nb) (line 28 with pois changed to nb) and run it. Which model would you report? Justify your choice with the three checks (AIC, dispersion ratio and expected zeros). Then compare the IRR for smoking and its 95% confidence interval in the two models, and say what the difference means for the conclusions.
Your output from Activity 4.4 reproduces the overdispersion checks in Table 4.9 and the model comparison in Table 4.10, and shows how an offset turns counts into rates. The key takeaways below draw the section together before its knowledge check.
Key Takeaways
- 6.1 A count records how many times something happened over a period, so it is a whole number of zero or more, and it is usually skewed to the right, with many zeros and a long tail (464 of the 795 PHAA participants made no urgent care visits). The Poisson distribution describes counts of this kind and is defined by a single number, its mean μ. Its key property is that its variance equals its mean, so a Poisson count with a mean of 0.8 should have a variance of about 0.8. When you are given a count, look first at
table(y),mean(y)andvar(y): a variance much larger than the mean is an early warning that the Poisson model may not fit, although it is only a first look, because it ignores the predictors. - 6.2 Poisson regression is the GLM with a Poisson distribution and a log link, fitted with
glm(urgent_visits ~ age + smoker, data = phaa, family = poisson), and each predictor multiplies the expected count. The exponentiated coefficients fromexp(cbind(IRR = coef(pois), confint(pois)))are incidence rate ratios (IRRs), on which 1 means no association, a value above 1 means more events and a value below 1 means fewer. Use one template for every IRR: an IRR of 1.44 means a rate 44% higher, and an IRR of 0.85 means a rate 15% lower, for a one-unit difference in the predictor with the other predictors held constant. When an IRR is given for a larger difference, such as ten years of age, read it for that difference:exp(10 * coef(pois)["age"])gives it from the unrounded coefficient as 1.13, or about 13% more visits per decade. If a predictor has been log-transformed, one unit on its log scale means that the original value is about 2.7 times as large (e1 ≈ 2.72), so its IRR compares people whose original values differ by that factor. Finish every interpretation by naming the comparison group, the variables held constant and the confidence interval. - 6.3 An offset is needed when people (or places) are observed for different lengths of time or have different population sizes, because a person followed for ten years has more time to accumulate events than a person followed for one. It is the log of each unit's follow-up time, added to the model with its coefficient fixed at 1, and it is written as
offset(log(fu_years))in the model formula. With the offset in place, the model describes rates, such as visits per person-year, so the IRRs compare rates rather than total counts, and a person's expected number of events is that rate multiplied by the time they were observed. Leaving the offset out can distort or even reverse a comparison, because a group followed for less time can have fewer events in total even though its events happen more often per year. In any question, check whether everyone was observed for the same period: if they were (as with urgent care visits over the same 12 months), no offset is needed. - 7.1 The Poisson model assumes that the variance equals the mean once the predictors are taken into account, and overdispersion, a variance larger than the mean, is common in health data because people differ in ways the predictors do not capture. Two checks after fitting tell you whether it is present. The dispersion ratio,
sum(residuals(pois, type = "pearson")^2) / df.residual(pois), should be close to 1, and a value clearly above 1 (above about 1.5) signals overdispersion; the observed zeros,sum(y == 0), should also be close to the zeros the model expects,sum(dpois(0, fitted(pois))). In the PHAA data, a ratio of 2.05 and 464 observed zeros against 363 expected both point to overdispersion, which makes the Poisson model overconfident: its standard errors are too small, its confidence intervals too narrow and its p-values too small, even when the IRR itself looks reasonable. Before you switch models, rule out apparent overdispersion caused by a missing predictor or a missing offset (see the callout Apparent Overdispersion). - 7.2 Negative binomial regression, fitted with
glm.nb()from the MASS package, keeps the log link and the IRR interpretation and adds one parameter, theta (θ), that lets the variance exceed the mean; a small theta means a lot of extra variation. It usually gives IRRs close to the Poisson ones with larger standard errors and wider confidence intervals, as for smoking in the PHAA data (an IRR of 1.44 in both models, with intervals of 1.19 to 1.73 and 1.08 to 1.91). Choose between the two models with three checks: the AIC fromAIC(pois, nb), where lower is better and a difference of about 10 points or more is strong support, provided both models are fitted to the same people; a dispersion ratio close to 1; and expected zeros that match the observed zeros. When you justify your choice, quote the numbers for all three checks, and remember that the change you should expect is in the uncertainty, not in the size of the IRR.
1. A falls-prevention study recorded the number of falls that each of 900 adults aged 65 and over had in the same 12 months. Of the 900, 520 (58%) had no falls and the largest count was 10; the mean was 0.83 and the variance was 1.94. Which statement is correct?
2. A Poisson regression of the number of falls gave the incidence rate ratios (IRRs) below, where lives_alone is 1 for adults living alone, exercise is 1 for adults who attend a weekly exercise class and age is in years. The last two lines give the IRR for a ten-year difference in age, which R calculates from the unrounded coefficient. Which interpretation is correct?
exp(10 * coef(pois)["age"]), is 1.34 rather than 1.30. IRRs are ratios, not differences in the number of falls, and they are neither proportions nor odds ratios. (Section 4, 6.2 Poisson Regression and Incidence Rate Ratios, Eq 4.5 and the paragraph on reading any IRR; Objective 6.2)3. A home-care program counts each client's emergency department visits while enrolled. New clients (n = 180) were enrolled for 4 months on average and made 0.9 visits; other clients (n = 620) were enrolled for 12 months and made 1.5 visits. A Poisson model without an offset gives an IRR for new clients of 0.60 (95% CI 0.50 to 0.72); with offset(log(months)) it gives 1.80 (95% CI 1.50 to 2.16). Why do the two models disagree, and which one shows how often each group uses the emergency department?
offset(log(months)), the IRR of 1.80 compares visits per month enrolled, which shows that new clients use the emergency department more often. A person's expected count is then the rate multiplied by the time observed, and the offset does not drop anyone: it adds each person's log follow-up time with its coefficient fixed at 1. A missing offset can make counts look overdispersed (the callout Apparent Overdispersion), but a negative binomial model without the offset would still compare totals. (Section 4, 6.3 Different Follow-Up Times: The Offset, the paragraph on the two consequences of the offset, and question 1 of Activity 4.4; Objective 6.3)4. The Poisson model of falls from Question 2 was checked with the output below. Which conclusion is correct?
5. A negative binomial model was fitted to the same falls data, with the results below. Which model should be reported, and why?
| Result | Poisson | Negative binomial |
|---|---|---|
| IRR for exercise (95% CI) | 0.78 (0.67 to 0.91) | 0.79 (0.63 to 0.99) |
| p-value for exercise | 0.001 | 0.04 |
| AIC | 2410.6 | 2236.2 |
| Dispersion ratio | 2.10 | 1.03 |
| Expected zeros (520 observed) | 415 | 517 |
6. A city health unit counted paramedic calls for suspected opioid overdose in each of its 60 neighbourhoods over the same year. The neighbourhoods have between 3,100 and 24,400 residents (pop). The predictors are income10 (median household income per $10,000) and shelter (1 = the neighbourhood has an emergency shelter). A colleague says: "Every neighbourhood was observed for the same year, so the offset can be left out." Which response is correct?
offset(log(pop)). A neighbourhood of 24,400 people would have more calls than one of 3,100 at the same rate of calls per resident, simply because more people live there, as a city has more cases than a town; the offset turns the model for counts into a model for rates, so 2.17 is a ratio of call rates per resident, with income held constant, and its interval excludes 1, as does the interval for income10 (0.70 to 0.80). An IRR is a ratio, not a difference in calls, and a negative binomial model allows extra variation but still compares total calls unless the offset is included (the callout Apparent Overdispersion). (Section 4, 6.2 Poisson Regression and Incidence Rate Ratios, 6.3 Different Follow-Up Times: The Offset, and the callout Apparent Overdispersion in 7.1; Objectives 6.2 and 6.3)Lesson 4: Final Assessment
Bringing It All Together
This lesson presented one regression model for each common type of outcome. Section 1 sorted variables into numeric (continuous or discrete) and categorical (binary, ordinal or nominal) types, reviewed the four assumptions of linear regression (linearity, independence, normality and equal variance of the residuals) and the plots that check them, and introduced the generalized linear model, which keeps the linear predictor and changes the distribution and the link function. It also reviewed logistic regression for binary outcomes and its requirement of enough events per predictor.
Section 2 fitted ordinal logistic regression to self-rated health. The model fits every at-or-above split of the outcome at once and gives each predictor one odds ratio for being in a higher category, an assumption that the Brant test checks. Section 3 fitted multinomial logistic regression to usual place of care. The model compares each category with a reference category, reports relative risk ratios for each comparison, and is often clearest when presented as predicted probabilities. Section 4 fitted Poisson regression to urgent care visits, found that the counts were overdispersed (a dispersion ratio of 2.05 and too few expected zeros), and fitted a negative binomial model that matched the data and gave wider confidence intervals that reflect the extra variation in the counts.
Across the lesson, the same two predictors were used with five different outcomes, and the same steps were followed each time: the outcome type was identified, the matching model was fitted, the exponentiated coefficients were read as the ratio that the link function implies, and the model's own assumptions were checked before the results were reported. The final assessment asks for these steps to be applied to new outcomes. One assumption is shared by every model in this lesson, and none of them can check it from its own output: the independence of the observations.
Key Takeaways from this lesson
- You can now classify an outcome as continuous, count, binary, ordinal or nominal from what its values mean, and choose its model and the name of its result: a difference in means for linear regression, an odds ratio for logistic and ordinal logistic regression, a relative risk ratio for multinomial logistic regression and an incidence rate ratio for Poisson and negative binomial regression. For the exam, classify the outcome before you do anything else, using the question text and the data dictionary rather than the way the values are stored, because a rating stored as 1 to 5 is still ordinal.
- You can now explain why binary, categorical and count outcomes break the assumptions of linear regression, say which plot from
plot(model)checks linearity, normality and equal variance (independence is judged from the study design), and describe a GLM by its distribution, linear predictor and link function. When you are shown residual plots, name the assumption each plot tests before you say whether it holds, and remember that the link function is what decides how a coefficient is read. - You can now interpret an odds ratio from a logistic regression with its confidence interval, explain why the crude and adjusted odds ratios can differ, and judge whether a model has enough events per predictor. Count the events first and allow about 10 per predictor, and treat a large gap between the crude and adjusted odds ratios as a sign of confounding by the variables that were added.
- You can now explain why an ordinal outcome is analysed with ordinal logistic regression rather than a linear regression on its codes or a logistic regression on two collapsed groups, read its odds ratio as the odds of a higher category at every split, describe its predicted probabilities for two people in plain words and judge the proportional-odds assumption from a Brant test. Check the order of the levels before you read any odds ratio, judge significance from the confidence intervals because
polr()gives no p-values, and remember that a Brant p-value below 0.05 is the warning sign. - You can now explain why a nominal outcome is analysed with multinomial logistic regression, interpret each relative risk ratio as a ratio of two ratios for one comparison with the reference category, use predicted probabilities for the overall chance of each category, and judge the independence of irrelevant alternatives by asking whether two categories are close substitutes. Always name both categories in an interpretation, remember that changing the reference changes only the comparisons reported, and check any "times as likely" claim against the predicted probabilities rather than the RRR.
- You can now describe count outcomes and the Poisson distribution, whose variance equals its mean, interpret incidence rate ratios from a Poisson regression (including one given for a ten-year difference in age), and explain when an offset is needed and that the IRRs then compare rates. Ask first whether everyone was observed for the same length of time: if not, the model needs
offset(log(time)), and each IRR compares rates per unit of time rather than total counts. - You can now check a Poisson model for overdispersion with the dispersion ratio and the observed and expected zeros, explain that overdispersion makes its standard errors, confidence intervals and p-values too small, and choose between Poisson and negative binomial regression with these checks and the AIC. Justify your choice with the numbers for all three checks, rule out a missing offset or predictor first, and expect the negative binomial model to change the uncertainty far more than the IRRs themselves.
The final assessment covers all four sections. All 16 questions must be answered correctly (100%) to finish the lesson.
Final Knowledge Assessment
1. A health authority followed 1,000 adults with type 2 diabetes for 6 to 24 months. A colleague's plan for four of the outcomes is shown below. Which response is correct?
| Outcome | Stored as | Planned model |
|---|---|---|
hba1c (HbA1c, %) | Values such as 6.8 or 9.1 | Linear regression |
distress (diabetes distress) | 0 = none, 1 = mild, 2 = moderate, 3 = severe | Linear regression, "because it is stored as numbers" |
care_site (main place of diabetes care) | 1 = family doctor, 2 = nurse practitioner, 3 = diabetes clinic, 4 = no regular provider | Ordinal logistic regression, "because its codes run from 1 to 4" |
ed_visits (emergency department visits during follow-up) | 0, 1, 2, … | Poisson regression |
hba1c (continuous, linear regression) and ed_visits (a count, Poisson regression) and corrects the other two. The information needed is what each stored value means. The distress codes 0 to 3 stand for ordered categories whose spacing is unknown, so a linear regression would treat each step as exactly one unit; the care_site codes 1 to 4 are labels for places with no order, so an ordinal model would invent a scale that does not exist. The tempting swap reads the codes rather than the categories, since distress has a natural order and place of care does not. ED visits are counts of events rather than ordered categories, and their model reports incidence rate ratios. (Section 1, 1.1 Types of Variables, Table 4.1, 1.2 Matching the Outcome to a Model and Table 4.2; Objectives 1.1 and 1.2)2. For the same study, a colleague proposes the four analyses below. Which proposal is appropriate as written?
| Proposal | Outcome | Planned analysis |
|---|---|---|
| 1 | ed_visits | Poisson regression on program completion, age and living alone, with no offset, because every person has a count |
| 2 | distress | Group None and Mild against Moderate and Severe, then fit a logistic regression |
| 3 | care_site | Multinomial logistic regression with Family doctor, the largest group, as the reference category |
| 4 | a1c_high (1 = HbA1c above 8%) | Linear regression of the 0/1 outcome on program completion, age and living alone |
care_site with a large, natural reference category. The information needed is the type of each outcome and the study design. ED visits are counts, but people were followed for 6 to 24 months, so proposal 1 needs offset(log(months)) to compare rates rather than totals; proposal 2 discards the difference between none and mild and between moderate and severe, and its answer depends on where the cut-off is placed, whereas an ordinal model uses every split; and proposal 4 fits a straight line to a binary outcome, which can predict impossible probabilities and cannot have normal residuals, so logistic regression is the model to use. The tempting proposal 1 names the right model but leaves out the offset that the unequal follow-up requires. (Section 1, 1.2 Matching the Outcome to a Model and Table 4.2; Section 2, 4.1 What Makes an Outcome Ordinal?; Section 4, 6.3 Different Follow-Up Times: The Offset; Objectives 1.2, 4.1 and 6.3)3. A colleague fitted lm(ed_visits ~ program + age10 + lives_alone) and drew plot(model). In Residuals vs Fitted, the residuals lie in parallel diagonal stripes with a long upper tail; in Q-Q Residuals, the points bend far above the line at the upper end; and in Scale-Location, the red line climbs from left to right. Which reading is correct?
urgent_visits. The stripes are not groups of related people, since independence is judged from the design rather than from a plot, and removing genuine frequent users would discard real data instead of fitting a model that suits counts. (Section 1, 2.1 Linear Regression and Its Assumptions and 2.2 Why Some Outcomes Break These Assumptions, Figure 4.3; Objectives 2.1 and 2.2)4. In the same study, 300 of the 1,000 adults had an HbA1c above 8% (a1c_high = 1). A logistic regression gave the odds ratios below, where program is 1 for adults who completed a self-management program and age10 is age in decades. Which interpretation is correct?
program as a multiplier of the odds and judges each association from its interval. The information needed is each odds ratio, its 95% CI and the other predictors in the model. An odds ratio of 0.62 means 0.62 times the odds, or 38% lower odds, of a high HbA1c for completers than for non-completers of the same age and living arrangement, and 0.46 to 0.84 lies below 1; the interval for lives_alone (0.90 to 1.65) includes 1, so its 22% higher odds are not statistically significant. The tempting first option reads the odds ratio as a proportion and ignores the interval. An odds ratio is also not a difference in HbA1c, and a confidence interval that excludes 1 shows significance at the 5% level even when no p-values are printed. (Section 1, 3.1.1 Reading Odds Ratios and Their Confidence Intervals and the callout Recall: Statistical Foundations; Objective 3.1)5. Fitted on its own, program gave a crude odds ratio of 0.50 (95% CI 0.38 to 0.66), against the adjusted 0.62 in Question 4. Completers were older on average, and older adults were less likely to have a high HbA1c. R gives the events per predictor for the three-predictor model below. Which statement is correct?
6. Diabetes distress was stored as an ordered factor (None, Mild, Moderate, Severe) and modelled with polr(), giving the odds ratios below. Which statement is correct?
polr(), an odds ratio above 1 makes the higher categories more likely, so 1.48 means 1.48 times the odds of a more severe category (for example, Moderate or Severe rather than None or Mild) at each split; program (0.46 to 0.73) and lives_alone (1.13 to 1.94) exclude 1, while age10 (0.82 to 1.01) includes it. The tempting first option forgets that "higher" here means more distress, and an odds ratio below 1 is not significant on its own when its interval includes 1. (Section 2, 4.3 Interpreting the Odds Ratios and the callout How R Writes the Ordinal Model; Objective 4.3)7. The Brant test for the distress model gave the results below. Separate logistic regressions at the three splits gave odds ratios for program of 0.61 (Mild or worse against None), 0.57 and 0.55 (Severe against the rest). Which statement is correct?
program differ only by amounts that chance would produce. The tempting first option reverses the test, since a small p-value, not a large one, is evidence against the assumption, and small differences between split-specific odds ratios are expected even when the assumption holds. (Section 2, 4.2 How the Model Works: A Series of Splits and 4.5 Checking the Proportional-Odds Assumption, the accordion panel "How the Brant test works"; Objectives 4.2 and 4.5)8. The predicted probabilities below, from the distress model, are for two 60-year-olds who live with others: one who did not complete the program and one who did. Which description is correct?
| Person | None | Mild | Moderate | Severe |
|---|---|---|---|---|
| Did not complete | 0.29 | 0.42 | 0.21 | 0.08 |
| Completed | 0.41 | 0.40 | 0.14 | 0.05 |
9. Main place of diabetes care (care_site: Family doctor, Nurse practitioner, Diabetes clinic, No regular provider) was modelled with multinom(), with Family doctor as the reference category. For living alone, the relative risk ratio in the No regular provider row is 2.05 (95% CI 1.35 to 3.11). Which statement is correct?
10. In the same model, the RRR for program in the Diabetes clinic row is 3.20 (95% CI 2.25 to 4.55). A colleague writes that "completers are 3.2 times as likely as non-completers to receive their diabetes care at a diabetes clinic". The predicted probabilities for two 60-year-olds who live with others are below. Which response is correct?
| Person | Family doctor | Nurse practitioner | Diabetes clinic | No regular provider |
|---|---|---|---|---|
| Did not complete | 0.58 | 0.15 | 0.12 | 0.15 |
| Completed | 0.45 | 0.16 | 0.30 | 0.09 |
11. A colleague says that the independence of irrelevant alternatives (IIA) assumption is met for care_site "because each adult names exactly one main place of care". Which response is correct?
12. ED visits during follow-up (6 to 24 months) were modelled with glm(ed_visits ~ program + age10 + lives_alone + offset(log(months)), family = poisson), giving the incidence rate ratios below. Which statement is correct?
offset(log(months)) and the IRR for program with its interval (0.67 to 0.82). Because follow-up ran from 6 to 24 months, the offset turns the model for counts into a model for visits per month, so 0.74 means that completers' rate of ED visits is 0.74 times, or 26% lower than, that of comparable non-completers, and the interval excludes 1; the expected number of visits for a person is then that rate multiplied by their months of follow-up. The tempting first option misdescribes the offset, which keeps everyone in the analysis; the offset is not a predictor like age, and an IRR is a ratio of rates, not a difference in visits, a proportion or an odds ratio. (Section 4, 6.2 Poisson Regression and Incidence Rate Ratios, 6.3 Different Follow-Up Times: The Offset and question 1 of Activity 4.4; Objectives 6.2 and 6.3)13. A second model adds log_inc, the natural logarithm of household income (in thousands of dollars). Its IRR is 0.85 (95% CI 0.77 to 0.94). Which interpretation is correct?
log_inc is a natural log, so a difference of 1 in log_inc means that income is multiplied by e1 ≈ 2.72. An IRR of 0.85 therefore compares adults whose incomes differ by that factor: the one with the higher income has a rate of ED visits 0.85 times as high, or 15% lower, and 0.77 to 0.94 excludes 1. The tempting first option reads the IRR per $1,000, as it would be read if income had been entered without the log, and the third option reads the IRR as a difference in visits rather than a ratio. (Section 4, 6.2 Poisson Regression and Incidence Rate Ratios, the paragraph on reading any IRR; Objective 6.2)14. The dispersion ratio of the ED-visits Poisson model was 3.40 without the offset and 2.62 with it. With the offset, the model expected 262 adults with no ED visits, while 380 were observed. A colleague says: "The extra spread was only there because the offset was missing, so the Poisson model is fine now." Which response is correct?
15. A negative binomial model with the same offset was fitted. The results for lives_alone, and the model checks, are below. Which statement is correct?
| Result | Poisson | Negative binomial |
|---|---|---|
Coefficient for lives_alone (SE) | 0.270 (0.045) | 0.262 (0.082) |
IRR for lives_alone (95% CI) | 1.31 (1.20 to 1.43) | 1.30 (1.11 to 1.53) |
| AIC | 3412.8 | 3051.6 |
| Dispersion ratio | 2.62 | 1.04 |
| Expected zeros (380 observed) | 262 | 377 |
16. A health authority followed 1,200 adults aged 65 and over who live at home, each for one full year, and modelled three outcomes on alone (1 = lives alone), age and gender. The estimates for alone are below. Which statement is correct?
| Outcome | Model and check | Estimate for alone (95% CI) |
|---|---|---|
| Number of falls in the year (0 to 9; 61% had none) | Negative binomial (the Poisson dispersion ratio was 2.4) | 1.38 (1.13 to 1.68) |
| Fear of falling: not afraid, somewhat afraid, very afraid | Ordinal logistic (Brant omnibus p = 0.38) | 1.52 (1.23 to 1.88) |
| Main help at home: paid home care, compared with none | Multinomial logistic (reference: none) | 2.10 (1.48 to 2.98) |
| Main help at home: community program, compared with none | Multinomial logistic (reference: none) | 1.20 (0.80 to 1.80) |
✦ Before submitting, pass every section knowledge check (100%).